Sunday, June 1, 2025
Invest Strategies Group
  • Investing
  • Economy
  • Business
  • Stock
No Result
View All Result
Invest Strategies Group
  • Investing
  • Economy
  • Business
  • Stock
No Result
View All Result
Invest Strategies Group
No Result
View All Result
Home Economy

Gold & Silver Analysis: Key Levels & Trendline Insights

admin by admin
November 8, 2024
in Economy
0
Gold & Silver Analysis: Key Levels & Trendline Insights
0
SHARES
1
VIEWS
Share on FacebookShare on Twitter

Overall Analysis

  1. Gold breaks the long-term supporting trendline and sustains below it. Previous buying swings are still intact. 
  2. Silver fell sharply on 6th Nov trading session, currently moving sideways, trying to hold level. 

Gold Chart Analysis 

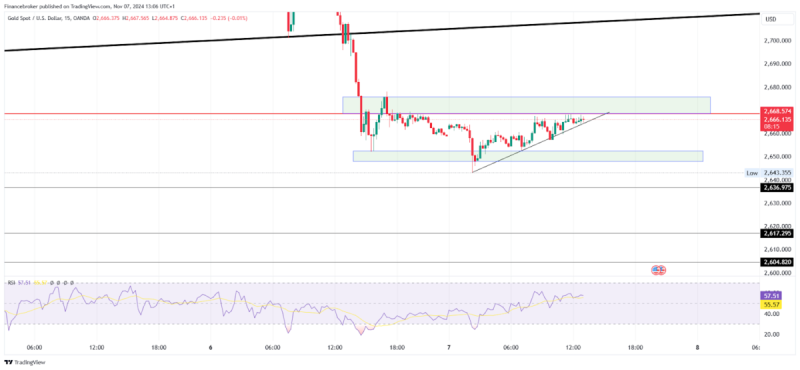
Gold/USD 15-Minute Chart (Source: TradingView)

On the 6th Nov 2024 trading session, gold broke the major supporting trendline and made a low of $2,652. Price continued falling, making a new low of $2,643 on 7th Nov and moving in a zone creating volatility. 

On a daily time frame price was moving in an upward channel where it was moving up while creating swings. Furthermore, as the market broke the supporting trendline, previous swing lows are still intact; the price will face heavy selling once it breaks the $2,604 level and sustains below it. 

Currently, the price is moving in a channel with support at $2,648 and resistance at $2,675. Gold recently made a new all-time high and has since reversed from the higher levels. This can be a distribution zone where more profit booking can be seen. 

There are a few entry triggers:

  1. If the price breaks the support level of $2,648 and sustains below it, sellers can plan an entry. The stop loss should be set above the previous swing high, with targets at $2,636 and $2,617.
  2. Currently, the price is moving in a trendline between support and resistance. If the price breaks below the trendline and holds, sellers can create a position with a stop loss placed above the previous swing high and a target set at $2,648.

Silver Chart Analysis 

Silver/USD 15-Minute Chart (Source: TradingView)

On the 6th Nov 2024 trading session, Silver broke the major support level and fell sharply around -4.5% and made a 30.816 low. Furthermore, after a sharp fall and high volatility market continued its movement in a sideways direction on 7th Nov. 

On the daily timeframe, the price can be seen breaking its long-term channel and falling sharply, but previous swings are still intact. More selling will trigger once the price breaks the 30.250 level and sustains below it, as it will change the uptrend into a downtrend. 

Currently, the price is moving in a tight zone where 31.2 is acting as resistance and 30.9 as support. After a sharp fall, the price is taking a halt at this level, and there are few entries one can follow to make an entry. 

  1. If the price breaks the 30.920 level and holds below it, sellers can plan an entry with a stop loss placed above the previous swing high and targets set at 30.250 and 29.877.
  2. If the price breaks the 31.230 level and holds above it, buyers can plan an entry with a stop loss placed below the previous swing low and a target of up to 31.599.

The post Gold & Silver Analysis: Key Levels & Trendline Insights appeared first on FinanceBrokerage.

Previous Post

Trump Media Group Stock (DJT) Surges 25% as Trump Wins

Next Post

Argentina Lithium Announces Amendment to the Terms of the Non-Brokered Private Placement Using The Listed Issuer Financing Exemption

admin

admin

Next Post
Argentina Lithium Announces Amendment to the Terms of the Non-Brokered Private Placement Using The Listed Issuer Financing Exemption

Argentina Lithium Announces Amendment to the Terms of the Non-Brokered Private Placement Using The Listed Issuer Financing Exemption

    Fill Out & Get More Relevant News


    Stay ahead of the market and unlock exclusive trading insights & timely news. We value your privacy - your information is secure, and you can unsubscribe anytime. Gain an edge with hand-picked trading opportunities, stay informed with market-moving updates, and learn from expert tips & strategies.

    Recommended

    Fed Watch: Key Bullish Patterns in the S&P 500, Utilities, and Crypto

    Fed Watch: Key Bullish Patterns in the S&P 500, Utilities, and Crypto

    May 9, 2025
    Bonds Get Death Cross SELL Signal

    Bonds Get Death Cross SELL Signal

    November 22, 2024

    Recent News

    Breakouts, Momentum & Moving Averages: 10 Must-See Stock Charts Right Now

    Breakouts, Momentum & Moving Averages: 10 Must-See Stock Charts Right Now

    June 1, 2025
    Week Ahead: NIFTY Stays In A Defined Range; Moving Past This Level Crucial For Resumption Of Upmove

    Week Ahead: NIFTY Stays In A Defined Range; Moving Past This Level Crucial For Resumption Of Upmove

    June 1, 2025
    Editor’s Picks: Gold Faces Bumpy Week on Trade Tensions, Platinum Stages Breakout

    Editor’s Picks: Gold Faces Bumpy Week on Trade Tensions, Platinum Stages Breakout

    June 1, 2025
    Run Your Stock Portfolio Like a Pro Sports Team

    Run Your Stock Portfolio Like a Pro Sports Team

    May 31, 2025
    Invest Strategies Group

    Browse by Category

    • Business
    • Economy
    • Investing
    • Stock

    Recent News

    Breakouts, Momentum & Moving Averages: 10 Must-See Stock Charts Right Now

    Breakouts, Momentum & Moving Averages: 10 Must-See Stock Charts Right Now

    June 1, 2025
    Week Ahead: NIFTY Stays In A Defined Range; Moving Past This Level Crucial For Resumption Of Upmove

    Week Ahead: NIFTY Stays In A Defined Range; Moving Past This Level Crucial For Resumption Of Upmove

    June 1, 2025
    • Privacy Policy
    • Terms & Conditions

    Copyright © 2025 investstrategiesgroup.com | All Rights Reserved

    No Result
    View All Result
    • Home 1
    • Home 2
    • Home 3
    • Home 4
    • Home 5
    • Home 6
    • Privacy Policy
    • Suspicious Page
    • Terms & Conditions
    • Thank you

    Copyright © 2025 investstrategiesgroup.com | All Rights Reserved