In Airbnb’s financial results for the third quarter, the company showed mixed performance as they slightly beat the expectations of the top line with a report of $3.73 billion.
It is a little more than the predicted $3.72 billion, but nevertheless, they were over the profit forecasts with a profit of only $2.13 per share which is just short of the predicted $2.14 per share. Though the income was encouraging, a 27.5% increase in sales and marketing expenses, totaling $514 million, impacted Airbnb’s profit.
Airbnb’s Global Expansion Drives Strong Booking Growth in Q3
The company appeared to be a good choice to boost bookings in those markets, according to Airbnb’s strategy. According to the company, the average growth rate of nights booked in new markets was twice higher than that in core markets, with the most evident growth in Asia-Pacific (19%) and Latin America (15%). Total nights and experiences have been increased by 8% to 122.8 million. This is a clear indication that international demand is the main driver of Airbnb stock for its growth.
The company’s gross booking value went up by 10% from last year to $20.1 billion, which is a clear indication of strong high demand for the product. Airbnb made a forecast of revenue between $2.39 billion and $2.44 billion for the fourth quarter, which has a probable increase of 8-10% from last year. Moreover, the average daily rate (ADR) increased by 1% year-over-year, bringing the ADR to $164, and more growth should come in the fourth quarter.
Airbnb stock maintained a constant implied take rate of around 18.6%, balancing revenue gains from cross-currency service fees with the cost of customer service investments. Despite the assurance of the addition of shares by 4% in after-hours trading, the company’s moto of international growth investments may come to fruition in the long run.
Airbnb Stock Chart Analysis
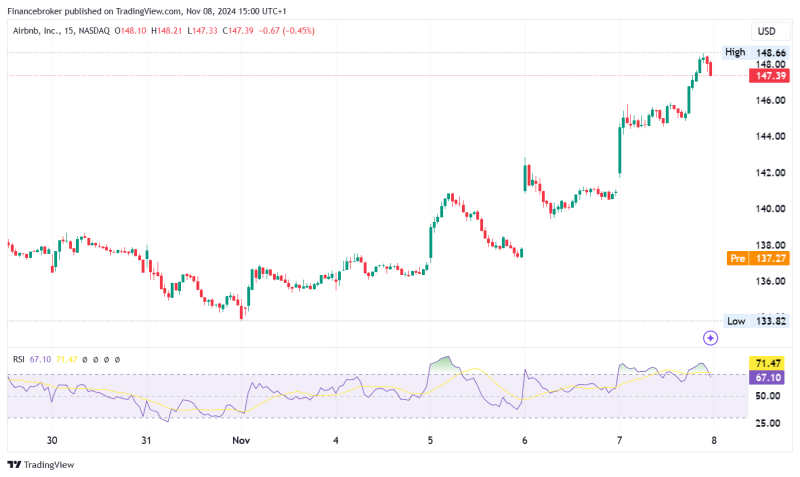
ABNB/USD 15-Minute Chart

The chart seen above is a 15-minute chart of Airbnb Inc. (ABNB) stock. ABNB has shown a consistently climbing trend recently, and it just recently broke the resistance at $148. Right after that, it went to the upside slightly and to a level at $147.39. It could be the new obstacle now if the price approaches this level again because, despite breaching the resistance, a build-up happened: $148.21 would be the new one. The price was at its pick of the day but then changed the course due to profit-taking or selling pressure.
The Relative Strength Index measures 67.10, nearing the overbought level of 70. This indicates the stock is not yet overbought but is close to reaching that condition. The RSI on the uptrend over 70 could lead to the buyers going down and the stock resting or even reversing for a while.
The level of support, the cost might be around $144, where it came to a pause before a breakout. If the stock succeeds in staying above this level, it is likely to gain more interest from the buyers, therefore making a bullish push possible. On the other hand, if it falls below this level of support, a greater correction could subsequently ensue, possibly going as low as $140 or even $138.
On the whole, traders should consider the RSI and recent peaks when evaluating new entries, even though the short-run inclination remains positive.
The post Airbnb Stock Q3 Revenue Beats Forecasts, Shares Drop 4% appeared first on FinanceBrokerage.


