First of all, for those of you looking for a new video this week, I have intentionally skipped it because I didn’t want to make a video right before such an important event with much uncertainty.
After the elections, which were obviously eventful, I wanted to see what the market’s reaction would be and let the dust settle down before diving into any analysis, which might have been too preoccupied and presumptuous too early.
However, it’s now Friday, the end of the week, and we have a little more color on how markets have responded to the election results. It’s time to see what the sector rotation is telling us and how the chart of the S&P 500 has changed—because it has definitely changed!
The S&P 500’s Post-Election Reversal
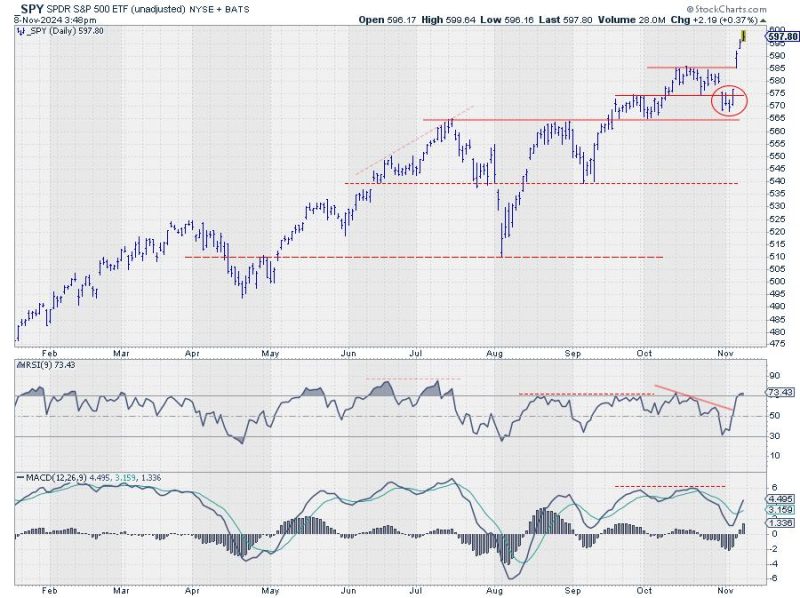
If you look at that chart right now with the annotations, which were the cornerstone of my view, I have to say that it was a little conservative going into the elections. This has now pretty much turned around. On the chart, a very clear island reversal is now visible.

We have the gap down on the 31st of October, followed by three more or less sideways days, which took SPY to a low of just around 567. On November 5th, election day, the market closed at the high, followed by a massive gap up the day after. It was not only a gap up but also a move above the S&P 500’s all-time highs.
So we have a massive gap up. We have an island reversal, which completed just above pretty important support around 565, and we now already have two days of good follow-through. That is a strong sign. This market wants to go higher, at least in the near term.
If we switch to the weekly chart for SPY, those mild divergences between the RSI and price and the MACD and price are still visible, but the price action itself is so strong that it cannot and should not be negated.
So, at least in the near term, this market wants to go higher. For now, corrections holding above support around 585 (the former peak) should be regarded as buying opportunities.
Reversals in Sector Rotation
On the relative rotation graph for the 11 S&P sectors above, I have intentionally set the tail length at six trading days. That means that each tail has seven nodes, and the 4th node, so the middle one, is November 5th. This allows us to see the 3 days leading up to election day and then the 3 days after election day. As you can see, most of the tails have continued to travel in the direction they were already heading.
The most prominent ones are consumer discretionary and communication services, which entered and moved further into the leading quadrant. On the other side is the utility sector, which accelerated further into the lagging quadrant.
Sectors with Notable Changes
I want to highlight a few sectors that really changed direction, where we saw a change in detail before and after election day. The two sectors with the most prominent changes are financials and health care.
This first RRG shows the tails for both sectors ending on the 5th of November.
Financials Sector (XLF)
If we zoom in on the tail for XLF, you can see that it ended November 5th just inside the weakening quadrant. It just crossed over from leading to weakening. Then, in the 3 days after November 5th, it completely reversed course and is now almost back into the leading quadrant.
Health Care Sector (XLV)
The same sort of move is visible on the other side of the chart for the healthcare sector, XLV. On November 5th, XLV had just crossed into the improving quadrant and was on a positive heading. In the 3 days after, the sector completely reversed course and is now back into the lagging quadrant at a negative heading.
XLP and XLRE Rolling Over
Other sectors where we see a change in the course of the tail include consumer staples, which was inside the improving quadrant but hooked back down, rolled over, and is now back into the lagging quadrant, and real estate, which was also inside the improving quadrant but rolled over and is now accelerating into the lagging quadrant.
The technology sector changed course a bit, but not as clearly as the other sectors. It is still right around the 100 level on the RS ratio scale and very close to the benchmark without a very clear direction.
The Big Winners Post-Election
I think the biggest winners from these election results with good potential going forward are consumer discretionary (XLY), and Communication Services (XLC).
XLY is obviously led by TSLA, which is distorting the performance of the consumer discretionary sector with an almost 27% gain in 3 days. But consumer discretionary stocks have picked up roughly between 3% and 7% across the board, which still indicates strength. The communication services sector is slightly more evenly spread out, and has a good base and a good foundation to move higher and push further into the leading quadrant.
Conclusion
All in all, the market as a whole seems to have reversed its course. After only a very mild corrective move, it has now started a new up leg in the existing uptrend. The sectors that have come out on top are consumer discretionary and communication services, followed by financials.
All 3 are on the right-hand side of the RRG, either already inside the leading quadrant or almost there, and traveling at a positive RRG heading. On the opposite side, the sectors with a less favorable outlook are health care, consumer staples, and utilities. Overall, the sector rotation has now shifted from defense back to offense.
#StayAlert, and have a great weekend. –Julius


