Overall Analysis
- Oil turned highly volatile continuously on the 2nd trading session. Price action indicates an uptrend.
- Natural Gas fell sharply, going -4% in a single day. High volatility and a tight zone continue.
Oil Chart Analysis
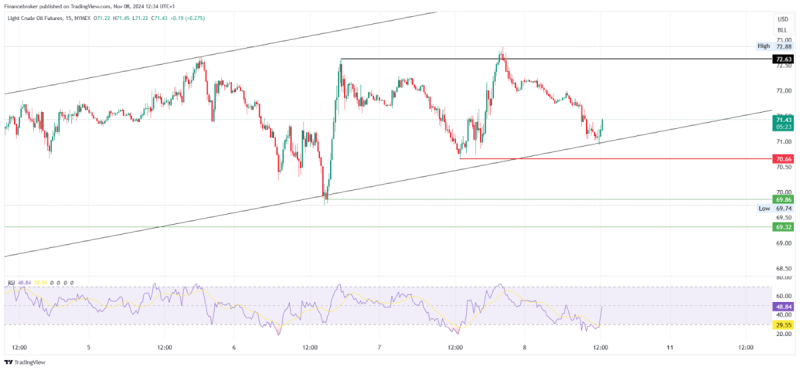
Oil/USD 15-Minute Chart (Source: TradingView)

On the 7th November 2024 trading session, oil can be seen highly volatile on the 2nd consecutive trading session, where the price went down near the supporting trendline and sharply reversed, breaking the 6th Nov day high of 72.63. Currently, the price is moving upwards in an uptrend channel but with high volatility.
On a daily time frame, the price is facing resistance from the 72.40 level, which has been a resistance for a long time. Closing the price above this level on the daily time frame will trigger a sharp rally towards the upside.
Looking at the price on a 15 min time frame, the price can be seen moving upwards in a channel, also creating an ascending triangle pattern. Oil is currently highly volatile, so traders should consider trading it only when it nears support or resistance levels.
There are multiple entry triggers one can follow for creating an entry.
- Oil is currently testing its long-term support trendline. If the price fails to break it and creates a reversal candle, buyers can consider making an entry with a stop loss placed below the previous swing low and a target of 72.60.
- If the price breaks the long-term supporting trendline and the candle successfully closes below the 70.66 level, then sellers may consider entering the trade with a stop loss placed above the previous swing high and a target of 60.86.
- A selling side entry can be planned if the price creates a rejection zone between the 72.63 and 72.40 levels, with a stop loss placed above the previous swing high and a target till the supporting trendline.
Natural Gas Chart Analysis
Gas/USD 15-Minute Chart (Source: TradingView)
On the 7th November 2024 trading session, Natural Gas gave a sideways opening. It then continued moving upwards, reaching a high of 2.8540. However, it sold off sharply, dropping to the 2.7630 level and marking a -4% fall. Natural Gas is moving in a peanut pattern with high volatility in it.
On a daily time frame, Natural Gas has made a double bottom-like structure, but the price has taken a halt for the last 4 trading sessions, which is currently very far from the pattern’s neckline.
The peanut pattern is forming on a 15 min time frame, and the price is respecting the levels. High volatility can be seen in the instrument. Planning entry based on support and resistance is safe in the current market.
Entry Triggers:
- If the price faces rejection from a descending resistance trendline, sellers may enter. They can set a stop loss above the previous swing highs and aim for a target at the supporting trendline.
- If the price settles above the descending resistance trendline, buyers may plan an entry. They should place a stop loss below the previous swing low and set a target at the 2.879 and 2.9010 levels.
The post Oil and Natural Gas Analysis: High Volatility & Trends appeared first on FinanceBrokerage.


