Overall Analysis
- Oil tanked more then -1.98% on Friday’s trading session, broke major supporting trendline and sustained below it.
- Natural Gas down by almost -1%, breaking the supporting trendline, currently at major level. Breakdowns may trigger massive selling.
Oil Chart Analysis
Oil/USD- 15 min time frame

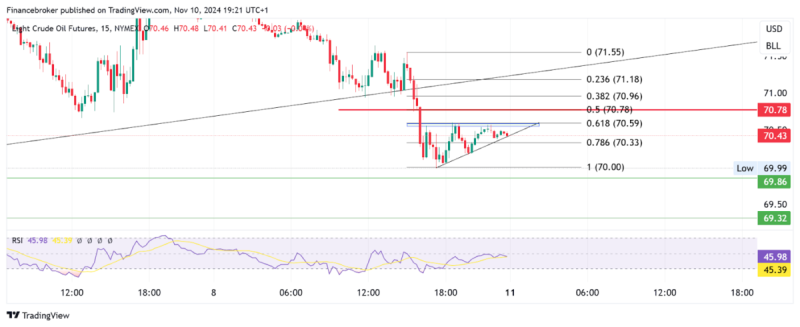
On the 8th November 2024 trading session, oil tanked more than -2%, breaking all the major supporting trending and closing below it. Price currently settled below the previous swing breaking the uptrend price action.
Looking at the price on hourly time frame, it might create a double top pattern and close below the neckline, triggering selling on hourly time frame too. The price was moving in an uptrend with higher high and higher low swing creation, finally breaking it on 8th November 2024.
Currently, in the 15 min time frame, the price is taking a halt after a major fall, creating an ascending triangle like structure. The price might go up to retest 0.5 feb retracement level of the fall or it can retest the supporting trendline. Thus far, it remains properly in the selling trend, indicating a few entry triggers mentioned below.
- If the price goes and retests previous supporting trendline and fails to close above it then sellers can consider entering the trade with a stop loss above previous swing high and target till 70 level.
- If the prices continue in the selling trend and continue below 69.86 level, then sellers may enter the trade with a stop loss above the previous swing high and target till 69.23 level.
Natural Gas Chart Analysis
Natural Gas/USD 15 min time frame
On the 7th November 2024 trading session, Natural Gas initially moved in the zone and faced support and resistance from the trendlines. The price fell sharply in the second half after rejecting from the resistance trendline, breaking the supports and settling below them.
On a daily time frame price can be seen shrinking. If it closes above 2.8695 level, it will trigger favorable conditions for the trending market. In the hourly time frame, the price was creating a peanut pattern, finally breaking it on 8th November 2024. The coming trading session will decide the direction.
Currently on a 15 min time frame price might break the supporting trendline of the peanut pattern and sustain below it. Moreover, it might take support from the 2.7507 level, respecting the previous support.
If looking for an entry trigger then there are few mentioned below.
- If the price went up for breakdown retesting then the seller may consider entering the trade with a stop loss above the previous swing high and target till 2.7507 level.
- If the price continues selling and breaks the 2.7507 level, then sellers may enter trade with a stop loss above the previous swing high and target till 2.6901 level.
The post Oil and Natural Gas Analysis: Price Decline Continues appeared first on FinanceBrokerage.


