Saturday, June 7, 2025
Invest Strategies Group
  • Investing
  • Economy
  • Business
  • Stock
No Result
View All Result
Invest Strategies Group
  • Investing
  • Economy
  • Business
  • Stock
No Result
View All Result
Invest Strategies Group
No Result
View All Result
Home Economy

USD/CHF in a strong up trend; USD/JPY breaks out of the zone

admin by admin
November 12, 2024
in Economy
0
USD/CHF in a strong up trend; USD/JPY breaks out of the zone
0
SHARES
2
VIEWS
Share on FacebookShare on Twitter

Overall Analysis

  • USD/CHF in an uptrend with strong channel support; the pair stays strong on the daily time frame.
  • USD/JPY breakout of the distribution zone; breaking the halt zone will decide the direction.

USD/CHF Chart Analysis

15 min time frame

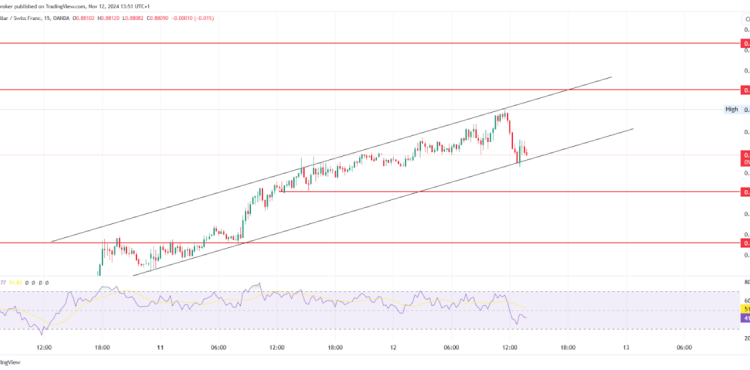
On the 11th Nov 2024, the pair kept its rally strong towards the upside with +0.55% returns. Price continues upwards in a channel-like structure with a higher high and higher low pattern creation.

Looking into the daily time frame, price gave a breakout of a cup and handle pattern. The expected target is 0.90600, which is nearly +3.80% from the breakout point. Currently, on the daily time frame, price needs to take a halt or create an area to continue its rally after the breakout.

Price can be seen moving upwards in a channel pattern on the 15 min time frame, with higher high and higher low creation. Strength is visible in the 15 min time frame.

There are a few trigger points mentioned below:

  • If price takes support from the ascending trendline and reverses, then buyers may consider entering the trade with a stop loss below the previous swing low and target till the resistance trendline or 0.88405 level.
  • If price breaks the ascending support trendline, then sellers may consider entering after price closes below 0.87908 with a stop loss above the previous swing high and target up to the 0.87660 level.

USD/JPY Chart Analysis

15 min time frame

On the 11th Nov 2024 trading session, the pair created a range area where the price showed sideways momentum while respecting support and resistance. Price broke the channel upwards on the 12th Nov, later creating a retest zone above it. Price might move upwards if it breaks the zone.

Currently, on a daily time frame, price can be seen breaking out of a flag and pole pattern and retesting the exact support. Positional buyers may consider entering the trade with a stop loss below 152.142 and a target till the 157.493 level.

Looking at the price on a 15 min time frame, price broke out of its distribution phase and is currently making a halt above the 153.968 level.

If looking for an entry trigger, then a few are mentioned below:

  • If price breaks and sustains above the 154.157 level, buyers may consider entering the trade with a stop loss below 153.968 and target till 154.357 and 154.666 on a trailing basis.
  • If price breaks down the halt zone, then sellers may consider entering the trade with a stop loss above the previous swing high and target the 153.482 level.

The post USD/CHF in a strong up trend; USD/JPY breaks out of the zone appeared first on FinanceBrokerage.

Previous Post

Bitcoin & Ethereum Analysis: BTC Hits High, ETH Is Steady

Next Post

Dollar Index Analysis: Strong Uptrend Faces Resistance Level

admin

admin

Next Post
Dollar Index Analysis: Strong Uptrend Faces Resistance Level

Dollar Index Analysis: Strong Uptrend Faces Resistance Level

    Fill Out & Get More Relevant News


    Stay ahead of the market and unlock exclusive trading insights & timely news. We value your privacy - your information is secure, and you can unsubscribe anytime. Gain an edge with hand-picked trading opportunities, stay informed with market-moving updates, and learn from expert tips & strategies.

    Recommended

    Nasdaq DROPS on Weak AMZN, TSLA & GOOGL Earnings!

    Nasdaq DROPS on Weak AMZN, TSLA & GOOGL Earnings!

    February 10, 2025
    New High Grade Gold Shoot at Ferke Project

    New High Grade Gold Shoot at Ferke Project

    March 17, 2025

    Recent News

    S&P 500 on the Verge of 6,000: What’s at Stake?

    S&P 500 on the Verge of 6,000: What’s at Stake?

    June 6, 2025
    Clusters of Long Winning Streaks: What They’re Telling Us

    Clusters of Long Winning Streaks: What They’re Telling Us

    June 6, 2025
    Three Charts Showing Proper Moving Average Alignment

    Three Charts Showing Proper Moving Average Alignment

    June 6, 2025
    In-fill RC Drilling at Kamperman Confirms High-Grade Gold

    In-fill RC Drilling at Kamperman Confirms High-Grade Gold

    June 6, 2025
    Invest Strategies Group

    Browse by Category

    • Business
    • Economy
    • Investing
    • Stock

    Recent News

    S&P 500 on the Verge of 6,000: What’s at Stake?

    S&P 500 on the Verge of 6,000: What’s at Stake?

    June 6, 2025
    Clusters of Long Winning Streaks: What They’re Telling Us

    Clusters of Long Winning Streaks: What They’re Telling Us

    June 6, 2025
    • Privacy Policy
    • Terms & Conditions

    Copyright © 2025 investstrategiesgroup.com | All Rights Reserved

    No Result
    View All Result
    • Home 1
    • Home 2
    • Home 3
    • Home 4
    • Home 5
    • Home 6
    • Privacy Policy
    • Suspicious Page
    • Terms & Conditions
    • Thank you

    Copyright © 2025 investstrategiesgroup.com | All Rights Reserved