
When looking for stocks to invest in, spotting strong stocks in promising sectors poised to bounce can be tricky and complicated. You have to forecast a sector’s likely position in the coming months, find stocks within those sectors that are relatively strong, and then dentify which ones are declining and which are near a bullish reversal.
Rather than following each stock individually to check if it meets the criteria, you can get a big-picture view with fewer steps using this tip for StockCharts’ highly useful MarketCarpets tool.
The first step is to analyze each sector, which you’ve hopefully included as part of your ChartLists. If you don’t have an S&P Sectors ChartList, it’s time to create one. If you read my article last week, you’d know that the strongest month for the Communications Services sector (using XLC as our proxy) is January. Right now, the sector is starting to pull back, yet XLC’s StockChartsTechnicalRank (SCTR) stands at 94, above the ultra-bullish 90 range.
You can also confirm this by opening up your MarketCarpets, selecting S&P Sector ETFs in the Select Group menu, selecting Bollinger Band Position in the Measurements menu, and selecting Latest Value in the Color By menu.
FIGURE 1 MARKETCARPETS CHART OF SECTOR ETFS. Notice that XLC is between +100 and -100, meaning it’s above the middle Bollinger Band.Image source: StockCharts.com. For educational purposes.

The Bollinger Band Position tells you where the stock is within the indicator:
- If the stock is near the top line, it’s close to +100.
- If it’s near the bottom line, it’s closer to -100.
- If it’s around the middle line (the average), it’s near 0.
XLC, the Communications sector proxy, is above the middle band and declining. So, why choose XLC over other sectors that are also declining but likely to bounce? Because XLC has an SCTR score of 94, and its seasonality profile is more favorable than the others.
FIGURE 2. SEASONALITY CHART OF XLC. January is a strong month for XLC and tends to outperform the S&P 500.Image source: StockCharts.com. For educational purposes.
The sector tends to decline in November but rises in December and January, its strongest seasonal month relative to the S&P 500.
Now go back to MarketCarpets and, under the Select Group menu, click on the Communications Sector.
FIGURE 3. MARKETCARPETS CHART OF THE COMMUNICATIONS SECTOR. Quite a mixed bag of stocks spread all over the upper and bottom bands.Image source: StockCharts.com. For educational purposes.
Remember the objective of this particular stage: You’re looking for strong stocks near the middle Bollinger band.
Now that you can see where each stock is positioned relative to the middle band, you’ll want to check their SCTR scores and overall momentum on a daily chart. Review each stock that meets the criteria and catches your interest.
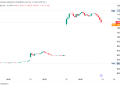
This morning, I found DoorDash (DASH), part of the Internet industry group, to be particularly interesting. It currently has a Bollinger Band Position of 53%. While DoorDash may not be the flashiest stock on Wall Street, it plays a key role in helping families by providing meal delivery when they’re short on time. Take a look at a daily chart of DoorDash below.
FIGURE 4. DAILY CHART OF DASH. The stock may be bound for a pullback. However, it also displays more buying pressure than its other sector peers.Chart source: StockCharts.com. For educational purposes.
If you go through the list of stocks in the previous MarketCarpets chart, you’ll find that many of the bigger names either lack buying pressure or display selling pressure based on the Chaikin Money Flow (CMF). The CMF may be receding a bit here, and surprisingly, buyers jumped in to scoop up shares of DASH as soon as it began dipping. However, DASH is in overbought territory according to the Money Flow Index (MFI), suggesting that further declines might be possible (unless buyers en masse decide that now’s the time to jump in).
Ideally, the price would fall closer to the middle Bollinger Band, which coincides with the second and third quadrant lines, both levels indicating strength within a pullback (see green rectangle). The bottom quadrant line marks the lowest swing point. If DASH closes below this level, then the current uptrend will no longer be valid.
Closing Bell
Finding the right stocks is all about following a structured process. By combining MarketCarpets with the Bollinger Band Position view, you can get a clearer picture of stocks positioned for a potential bounce. Start with sector analysis and drill down to find the best picks. Not only does this approach save time, it’s one of the few efficient ways to go through this process both quickly and effectively, which is a key advantage in a rapidly changing market.
Disclaimer: This blog is for educational purposes only and should not be construed as financial advice. The ideas and strategies should never be used without first assessing your own personal and financial situation, or without consulting a financial professional.


