
How do you find the next big stock before it gains the investing public’s attention?
It’s tricky, but there are only two ways to spot a so-called “hot stock” before the social buzz. One is to scour financial reports and forum chatter to see what Wall Street insiders might be looking at before the general public catches. Another is to use various scans to trace the smart money’s tracks before the news gets out.
Alternatively, you could do both.
(As far as the latter—scanning for stocks exhibiting technical strength—perhaps it’s something you should be doing daily, as you have plenty of tools to scan every sector and stock on the market rapidly.)
Tuesday’s Scan After the Close
On Tuesday, I did an after-market scan to prepare for the following day’s trading session. Pulling up the StockCharts Sample Scan Library from the Charts & Tools menu, I ran a scan for New 52-week Highs and categorized the Symbols by the StockChartsTechnicalRank (SCTR) score.
FIGURE 1. NEW 52-WEEK HIGHS SCAN RESULTS. AppLovin is at the top when sorted by SCTR scores.Image source: StockCharts.com. For educational purposes.
The mobile marketing tech company AppLovin (APP) had the highest SCTR score and a new 52-week high. I realized that APP was also on the SCTR Top 10 report, which is visible on the SCTR Reports Dashboard panel.
FIGURE 2. SCTR REPORT TOP 10 LIST. APP been on this list for a while but its move to the top position is worth noting.Image source: StockCharts.com. For educational purposes.

If you’ve been following the SCTR Reports from time to time, you might have noticed that APP has been occupying the top 10 list for quite some time. APP, though not the most popular stock (perhaps until now), has been abuzz among institutional and tech investors for quite some time. It makes you wonder what other scans APP might have shown up on.
In the Symbol Summary tool, here’s what came up Tuesday afternoon.
FIGURE 3. LIST OF SCANS ON SYMBOL SUMMARY THAT INCLUDED APP. It’s time to do a deeper dive.Image source: StockCharts.com. For educational purposes.
At the least, APP’s appearance on several scans tells you it’s time to do a deeper top-down dive on the stock. Let’s start with a weekly chart to get a big-picture view of APP’s price history.
FIGURE 4. WEEKLY CHART OF APP. The stock price had a parabolic upside move.Chart source: StockCharts.com. For educational purposes.
That’s a jaw-dropping 1,303% jump (see percent line measurement in the chart). And it begs two questions: Were there early signs to get into the stock when APP was just at $30, and is it now just a FOMO trade, or is there still room for growth?
Starting with the first question, the earliest technical indication was in May 2023 (see blue dotted vertical line) when two things coincided (green circles highlight each event):
- The Chaikin Money Flow (CMF) broke through the zero line, indicating that buyers controlled the market.
- The SCTR line shot up to around 99, well above the bullish 90 line.
At this point, you’re probably wondering if there’s still room for APP valuations to grow or if it’s now just a FOMO trade. Here, we’ll shift to a daily chart of APP to take a closer look.
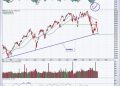
FIGURE 5. DAILY CHART OF APP. There are multiple levels of support for the looming pullback.Chart source: StockCharts.com. For educational purposes.
APP’s runaway gap followed a stellar earnings report. The divergence between the CMF and the On Balance Volume (OBV) lines shows a potential decrease in institutional buying (represented by the CMF) versus retail FOMO (using OBV as a proxy). The Relative Strength Index (RSI) is clearly in overbought territory, but APP’s price action also shows how the RSI can sustain extreme levels for an extended period of time.
In the daily chart, three indicators show potential convergence at support levels. The Ichimoku Cloud provides a dynamic support range that shifts with price action, aligning with the quadrant lines, especially the third quadrant just below the 50% retracement. Keep in mind that the second and third quadrants typically signal bullish levels during a pullback. Lastly, notice the Bollinger Bands, where the middle band also falls within the third quadrant.
If APP starts pulling back, as it seems likely, and you’re bullish on the stock, watch these levels closely. How the price reacts at these points can guide you in making a more informed decision about when to take action.
At the Close
The steps to spotting a potential breakout stock like AppLovin highlight the importance of analysis using differentiated tools to uncover hidden opportunities. From initial scans to spot technical strength to deep dives using SCTR rankings and Symbol Summary insights, the journey of discovery relies on methodical steps. Whether you’re looking to catch the next big move or planning entry points during a pullback, the takeaway is clear: consistent, multi-layered scanning and analysis is the key to finding market gems early on.
Disclaimer: This blog is for educational purposes only and should not be construed as financial advice. The ideas and strategies should never be used without first assessing your own personal and financial situation, or without consulting a financial professional.


