Thursday, June 5, 2025
Invest Strategies Group
  • Investing
  • Economy
  • Business
  • Stock
No Result
View All Result
Invest Strategies Group
  • Investing
  • Economy
  • Business
  • Stock
No Result
View All Result
Invest Strategies Group
No Result
View All Result
Home Economy

NVIDIA Corporation (NASDAQ:NVDA) shares fell roughly 3%

admin by admin
November 22, 2024
in Economy
0
NVIDIA Corporation (NASDAQ:NVDA) shares fell roughly 3%
0
SHARES
1
VIEWS
Share on FacebookShare on Twitter

NVIDIA Corporation (NASDAQ: NVDA) reported strong fiscal Q3 results that exceeded Wall Street estimates but provided Q4 guidance that fell short of heightened investor expectations. Shares dropped approximately 3% in premarket trading following the announcement.

For Q3, NVIDIA posted earnings per share (EPS) of $0.81 on revenue of $35.1 billion, surpassing analyst expectations of $0.75 EPS on $33.09 billion revenue. A key driver was the data center segment, which generated $30.8 billion, marking a 17% sequential increase and a remarkable 112% year-over-year growth, beating forecasts of $28.84 billion.

Looking to Q4, NVIDIA projects revenue of $37.5 billion, plus or minus 2%, slightly above consensus estimates of $37.09 billion. Gross margins are anticipated at 73.0%, signaling robust profitability despite modest guidance.

Analysts expressed mixed views. Bank of America highlighted near-term investor caution due to subdued excitement but reaffirmed confidence in NVIDIA’s long-term growth potential, emphasizing its leadership in transitioning legacy infrastructure to AI-accelerated systems. Piper Sandler echoed optimism, noting that the company remains well-positioned for significant growth starting in April.

In summary, NVIDIA’s solid fundamentals and leadership in AI position it as a long-term winner, though near-term volatility may persist as investors digest its tempered Q4 outlook.

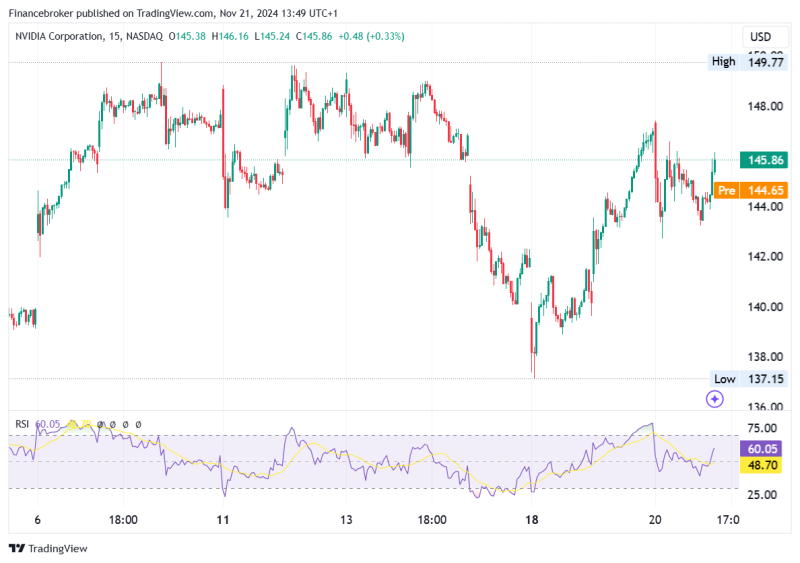
Nvidia Stock Chart Analysis

This chart displays NVIDIA Corporation’s (NVDA) stock performance on a 15-minute timeframe. The current price is $145.86, reflecting a slight increase of +0.33% during the day. The chart features candlestick patterns, showing the stock’s price movements, with highs and lows clearly marked.

The RSI (Relative Strength Index) indicator at the bottom reveals momentum dynamics. It’s hovering near 60.05, which suggests moderate bullish momentum, moving away from neutral levels. The RSI isn’t overbought yet (above 70), indicating room for further upward movement.

Recent trading action shows a recovery from a low of $137.15, with the price approaching previous resistance around $146.16. If this level breaks, it might signal a continued uptrend; otherwise, a pullback could occur. Traders should monitor the $144.76 support zone and $149.77 resistance for further signals.

Overall, NVDA’s short-term trend appears cautiously bullish, supported by improving RSI momentum.

The post NVIDIA Corporation (NASDAQ:NVDA) shares fell roughly 3% appeared first on FinanceBrokerage.

Previous Post

Starbucks Stock: Exploring Partnerships in China

Next Post

Jindalee Lithium

admin

admin

Next Post
Jindalee Lithium

Jindalee Lithium

    Fill Out & Get More Relevant News


    Stay ahead of the market and unlock exclusive trading insights & timely news. We value your privacy - your information is secure, and you can unsubscribe anytime. Gain an edge with hand-picked trading opportunities, stay informed with market-moving updates, and learn from expert tips & strategies.

    Recommended

    Why Now Might Be the Best Time to Invest in META Stock

    Why Now Might Be the Best Time to Invest in META Stock

    December 24, 2024
    KuCoin Fined $300M for Unlicensed U.S. Operations

    KuCoin Fined $300M for Unlicensed U.S. Operations

    January 29, 2025

    Recent News

    S&P 500 Bullish Patterns: Are Higher Highs Ahead?

    S&P 500 Bullish Patterns: Are Higher Highs Ahead?

    June 5, 2025
    Strategic Chaos or Tactical Goldmine? What QQQ’s Chart is Whispering Right Now

    Strategic Chaos or Tactical Goldmine? What QQQ’s Chart is Whispering Right Now

    June 5, 2025
    Why ADX Can Mislead You — And How to Avoid It

    Why ADX Can Mislead You — And How to Avoid It

    June 5, 2025
    S&P 500 on the Verge of 6,000: What’s at Stake?

    S&P 500 on the Verge of 6,000: What’s at Stake?

    June 5, 2025
    Invest Strategies Group

    Browse by Category

    • Business
    • Economy
    • Investing
    • Stock

    Recent News

    S&P 500 Bullish Patterns: Are Higher Highs Ahead?

    S&P 500 Bullish Patterns: Are Higher Highs Ahead?

    June 5, 2025
    Strategic Chaos or Tactical Goldmine? What QQQ’s Chart is Whispering Right Now

    Strategic Chaos or Tactical Goldmine? What QQQ’s Chart is Whispering Right Now

    June 5, 2025
    • Privacy Policy
    • Terms & Conditions

    Copyright © 2025 investstrategiesgroup.com | All Rights Reserved

    No Result
    View All Result
    • Home 1
    • Home 2
    • Home 3
    • Home 4
    • Home 5
    • Home 6
    • Privacy Policy
    • Suspicious Page
    • Terms & Conditions
    • Thank you

    Copyright © 2025 investstrategiesgroup.com | All Rights Reserved