Friday, June 6, 2025
Invest Strategies Group
  • Investing
  • Economy
  • Business
  • Stock
No Result
View All Result
Invest Strategies Group
  • Investing
  • Economy
  • Business
  • Stock
No Result
View All Result
Invest Strategies Group
No Result
View All Result
Home Stock

Four Prerequisites to Improve Your Odds – A Live Example

admin by admin
November 23, 2024
in Stock
0
Four Prerequisites to Improve Your Odds – A Live Example
0
SHARES
3
VIEWS
Share on FacebookShare on Twitter

Even though trading based on chart analysis involves some discretionary decisions, chartists can improve the odds of success by systematizing their process. This report will show four prerequisite filters based on a top-down approach. We will start with the broader market, look at the sector, and then apply two qualifying filters to the stock.

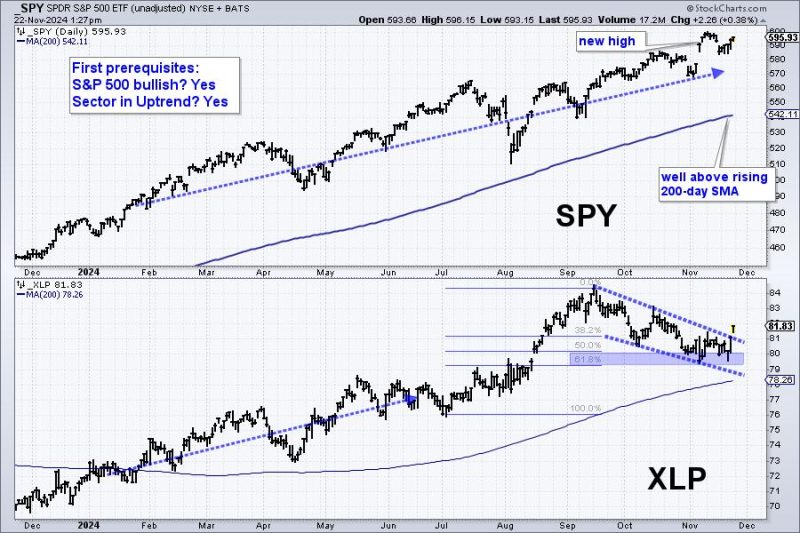
First, I would make sure we are in a bull market. The chart below shows SPY hitting a new high in early November and trading well above its rising 200-day. This is clearly bullish for the market as a whole.

Second, I would ensure the sector is also in a long-term uptrend. TJX Cos (TJX) is part of the Consumer Staples SPDR (XLP) and this sector recorded a new high in September. It fell back into November, but remains above its rising 200-day SMA, and in a long-term uptrend. Note that TJX featured in our report and video on Friday. Click here to join and get two bonus reports.  

Also notice that XLP is breaking out this week. The ETF formed a falling wedge and retraced 50-62.18% of the July-September advance. Both the pattern and the retracement are normal for corrections within bigger uptrends. XLP is breaking out of the wedge to signal a continuation of the bigger uptrend.

Turning to the stock filters, I want the stock to be in a long-term uptrend and to show upside leadership. On the TJX chart below, prices are moving from the lower left to the upper right, and the stock recorded a new high this month. Stocks hitting new highs are in strong uptrends and show upside leadership. Also notice that the 10-day EMA is 9.8% above the 200-day EMA. The bottom indicator shows the PPO (10,200,0), capturing the percentage difference between these two EMAs.

TJX meets all the prerequisites and also sports a bullish breakout on the price chart. After surging to a new high in mid August, the stock consolidated with a triangle. A consolidation within an uptrend is a bullish continuation pattern. TJX broke out with a strong move in November and this signals a continuation of the uptrend. Re-evaluation support is set at 112. 

Highlights from Recent Reports/Videos:

  • S&P SmallCap 600 SPDR surges after throwback to breakout zone.
  • A Short-term setup could lead to a long-term breakout for DataDog (DDOG).
  • Medical Devices stand out in an underperforming healthcare sector.
  • Robotics & AI ETF triggers big breakout and holds above breakout zone.
  • Gold and Uranium break out as Lithium sets up.

Click here to join and get two bonus reports!

//////////////////////////////////

Previous Post

2024 is Shaping Up Like 2021, Which Did Not End Particularly Well

Next Post

‘Wicked’ tallies $19M in previews, as ‘Gladiator II’ team-up heads for $200M opening weekend

admin

admin

Next Post
‘Wicked’ tallies $19M in previews, as ‘Gladiator II’ team-up heads for $200M opening weekend

‘Wicked’ tallies $19M in previews, as ‘Gladiator II’ team-up heads for $200M opening weekend

    Fill Out & Get More Relevant News


    Stay ahead of the market and unlock exclusive trading insights & timely news. We value your privacy - your information is secure, and you can unsubscribe anytime. Gain an edge with hand-picked trading opportunities, stay informed with market-moving updates, and learn from expert tips & strategies.

    Recommended

    Adrian Day: Gold Stock Setup is “Perfect,” Waiting on the West

    Adrian Day: Gold Stock Setup is “Perfect,” Waiting on the West

    February 2, 2025
    The Best Five Sectors, #3

    The Best Five Sectors, #3

    January 20, 2025

    Recent News

    S&P 500 on the Verge of 6,000: What’s at Stake?

    S&P 500 on the Verge of 6,000: What’s at Stake?

    June 6, 2025
    Clusters of Long Winning Streaks: What They’re Telling Us

    Clusters of Long Winning Streaks: What They’re Telling Us

    June 6, 2025
    Three Charts Showing Proper Moving Average Alignment

    Three Charts Showing Proper Moving Average Alignment

    June 6, 2025
    In-fill RC Drilling at Kamperman Confirms High-Grade Gold

    In-fill RC Drilling at Kamperman Confirms High-Grade Gold

    June 6, 2025
    Invest Strategies Group

    Browse by Category

    • Business
    • Economy
    • Investing
    • Stock

    Recent News

    S&P 500 on the Verge of 6,000: What’s at Stake?

    S&P 500 on the Verge of 6,000: What’s at Stake?

    June 6, 2025
    Clusters of Long Winning Streaks: What They’re Telling Us

    Clusters of Long Winning Streaks: What They’re Telling Us

    June 6, 2025
    • Privacy Policy
    • Terms & Conditions

    Copyright © 2025 investstrategiesgroup.com | All Rights Reserved

    No Result
    View All Result
    • Home 1
    • Home 2
    • Home 3
    • Home 4
    • Home 5
    • Home 6
    • Privacy Policy
    • Suspicious Page
    • Terms & Conditions
    • Thank you

    Copyright © 2025 investstrategiesgroup.com | All Rights Reserved