Thursday, June 5, 2025
Invest Strategies Group
  • Investing
  • Economy
  • Business
  • Stock
No Result
View All Result
Invest Strategies Group
  • Investing
  • Economy
  • Business
  • Stock
No Result
View All Result
Invest Strategies Group
No Result
View All Result
Home Stock

Plunge in Treasury Yields Triggers Gap-Surge in Home Builders

admin by admin
November 28, 2024
in Stock
0
Plunge in Treasury Yields Triggers Gap-Surge in Home Builders
0
SHARES
0
VIEWS
Share on FacebookShare on Twitter

The 10-yr Treasury Yield reversed its upswing with a sharp decline and the Home Construction ETF (ITB) reacted with a noteworthy gap-surge. Today’s report analyzes the yield, the TBond ETF (IEF) and ITB.  The 10-yr Treasury Yield plunged as Treasury bonds surged on the heels of a new nomination for Treasury secretary. These moves lifted small-caps, banks and homebuilders. Banks have been leading for some time and small-caps started their move last week (as noted in Chart Trader last week). Homebuilders held out for interest rates and got their catalyst on Monday. The only concern here is that the move in Treasuries is a knee-jerk reaction. Follow through would confirm the validity of these short-term reversals.

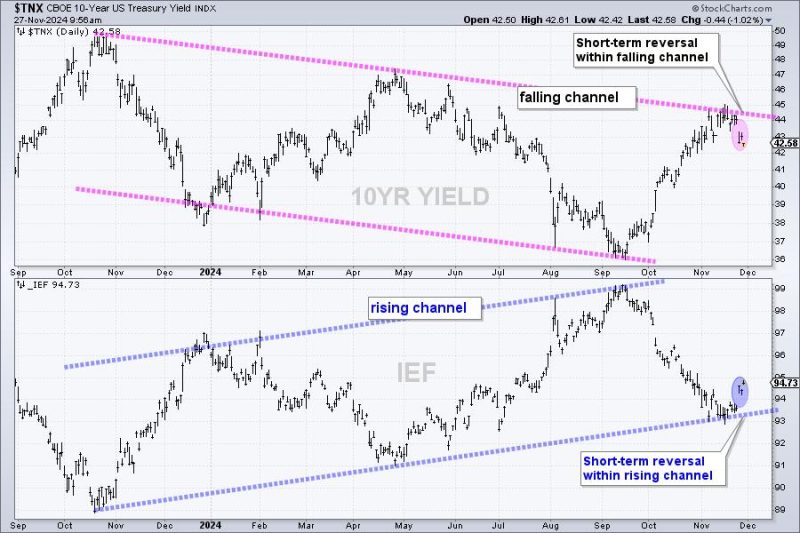
The first chart shows the 10-yr Treasury Yield ($TNX) in the top window and the 7-10 Yr Treasury Bond ETF (IEF). $TNX is the yield multiplied by 10. I used this version because it is updated in real-time, as opposed to end of day. $TNX and IEF are mirror images. The 10yr Yield is within a large falling channel and the 7-10Yr T-Bond ETF is within a large rising channel. The yield falls when the bond price rises.

These two caught my eye because they reversed the swings within their respective channels. $TNX fell sharply to reverse the upswing, which extended from mid September to mid October. This means the short-term trend (down) is now aligned with the long-term trend (down). On the flip-side, IEF surged and reversed its downswing. This means the short-term trend (up) is now aligned with the long-term trend (up).

Small-caps reacted to the plunge in yields with a surge the last three days. Actually, small-caps started moving higher before the 10-yr Treasury Yield surged and we noted this in the Chart Trader report on Thursday before the open. Moving to this week, the Home Construction ETF (ITB) also caught a strong bid as the 10-yr Treasury Yield fell on Monday. ITB gapped up and surged 5% on Monday. 

Next we will analyze the charts for ITB and five home builder stocks. This members-only report covers the long-term trends, medium chart setups and the recent momentum thrusts. 

Click here to join and get two bonus reports!

////////////////////////////////////////////////////////////

Previous Post

Can the S&P 500 Rally Without Tech?

Next Post

FTC opens broad antitrust investigation into Microsoft

admin

admin

Next Post
FTC opens broad antitrust investigation into Microsoft

FTC opens broad antitrust investigation into Microsoft

    Fill Out & Get More Relevant News


    Stay ahead of the market and unlock exclusive trading insights & timely news. We value your privacy - your information is secure, and you can unsubscribe anytime. Gain an edge with hand-picked trading opportunities, stay informed with market-moving updates, and learn from expert tips & strategies.

    Recommended

    Fox streaming service to be called Fox One, launch before NFL season

    Fox streaming service to be called Fox One, launch before NFL season

    May 13, 2025
    Identifying GREAT Trades and Looking Ahead to 2025 Using RRG Charts

    Identifying GREAT Trades and Looking Ahead to 2025 Using RRG Charts

    December 16, 2024

    Recent News

    S&P 500 Bullish Patterns: Are Higher Highs Ahead?

    S&P 500 Bullish Patterns: Are Higher Highs Ahead?

    June 5, 2025
    Strategic Chaos or Tactical Goldmine? What QQQ’s Chart is Whispering Right Now

    Strategic Chaos or Tactical Goldmine? What QQQ’s Chart is Whispering Right Now

    June 5, 2025
    Why ADX Can Mislead You — And How to Avoid It

    Why ADX Can Mislead You — And How to Avoid It

    June 5, 2025
    S&P 500 on the Verge of 6,000: What’s at Stake?

    S&P 500 on the Verge of 6,000: What’s at Stake?

    June 5, 2025
    Invest Strategies Group

    Browse by Category

    • Business
    • Economy
    • Investing
    • Stock

    Recent News

    S&P 500 Bullish Patterns: Are Higher Highs Ahead?

    S&P 500 Bullish Patterns: Are Higher Highs Ahead?

    June 5, 2025
    Strategic Chaos or Tactical Goldmine? What QQQ’s Chart is Whispering Right Now

    Strategic Chaos or Tactical Goldmine? What QQQ’s Chart is Whispering Right Now

    June 5, 2025
    • Privacy Policy
    • Terms & Conditions

    Copyright © 2025 investstrategiesgroup.com | All Rights Reserved

    No Result
    View All Result
    • Home 1
    • Home 2
    • Home 3
    • Home 4
    • Home 5
    • Home 6
    • Privacy Policy
    • Suspicious Page
    • Terms & Conditions
    • Thank you

    Copyright © 2025 investstrategiesgroup.com | All Rights Reserved