Wednesday, June 4, 2025
Invest Strategies Group
  • Investing
  • Economy
  • Business
  • Stock
No Result
View All Result
Invest Strategies Group
  • Investing
  • Economy
  • Business
  • Stock
No Result
View All Result
Invest Strategies Group
No Result
View All Result
Home Economy

Stock Futures Lower after S&P 500 futures ticked down 0.18%

admin by admin
December 3, 2024
in Economy
0
Stock Futures Lower after S&P 500 futures ticked down 0.18%
0
SHARES
0
VIEWS
Share on FacebookShare on Twitter

Stock futures are trading slightly lower Monday morning as investors gear up for the final month of 2024. S&P 500 futures slipped 0.18%, alongside declines in Dow Jones Industrial Average futures and Nasdaq 100 futures, which dropped 0.13% and 0.17%, respectively. The market’s focus is shifting to upcoming economic data, particularly reports on manufacturing and construction spending, ahead of this week’s key labor data releases.

November was a standout month for equities, with the S&P 500 futures rallying to reflect the index’s best monthly performance of the year. Both the S&P 500 and Dow Jones Industrial Average achieved all-time highs during Friday’s shortened trading session, with the Dow briefly surpassing 45,000. Small-cap stocks also saw robust gains, with the Russell 2000 index surging over 10% in November, buoyed by optimism around potential tax cuts.

As trading kicks off in December, investors are keeping a close eye on geopolitical developments in Europe, where France’s CAC 40 index dropped 0.77% amid political concerns, while Germany’s DAX and the U.K.’s FTSE 100 showed smaller declines.

S&P 500 futures will likely continue to act as a key barometer for market sentiment, particularly as traders assess the impact of upcoming economic data and global market developments.

S&P 500 Index Chart Analysis

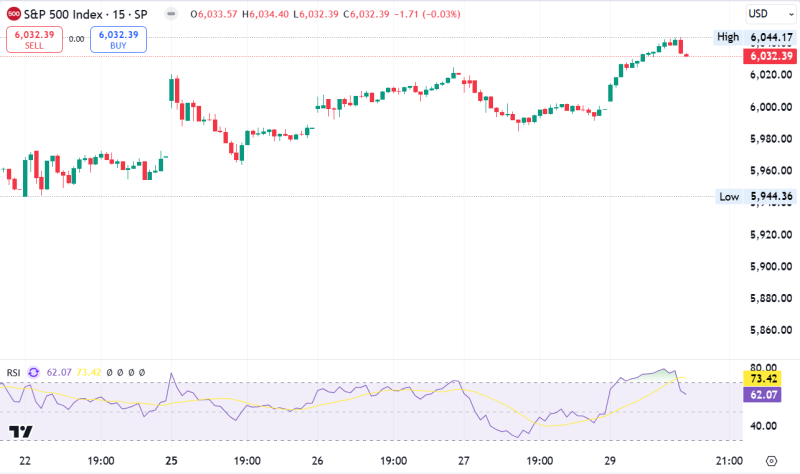
This 15-minute chart of the S&P 500 Index shows a recent trend where the index attempted to break above the resistance level near 6,044.17 but retraced slightly to close at 6,032.39, reflecting a minor decline of 0.03% in the session. The candlestick pattern indicates some indecisiveness after a steady upward momentum seen earlier in the day.

On the RSI (Relative Strength Index) indicator, the value sits at 62.07, having declined from the overbought zone above 70 earlier. This suggests that the bullish momentum might be cooling off, and traders could anticipate a short-term consolidation or slight pullback. However, with RSI above 50, the overall trend remains positive, favoring buyers.

The index’s recent low of 5,944.36 marks a key support level, while the high at 6,044.17 could act as resistance. If the price sustains above the 6,020 level and RSI stabilizes without breaking below 50, the index could attempt another rally. Conversely, a drop below 6,020 could indicate a bearish shift.

In conclusion, the index displays potential for continued gains, but traders should watch RSI levels and price action near the support and resistance zones for confirmation.

The post Stock Futures Lower after S&P 500 futures ticked down 0.18% appeared first on FinanceBrokerage.

Previous Post

Rush orders, cut costs, crossed fingers: How small businesses are preparing for tariffs

Next Post

CSE Bulletin: Consolidation – Terra Clean Energy Corp.

admin

admin

Next Post
CSE Bulletin: Consolidation – Terra Clean Energy Corp.

CSE Bulletin: Consolidation – Terra Clean Energy Corp.

    Fill Out & Get More Relevant News


    Stay ahead of the market and unlock exclusive trading insights & timely news. We value your privacy - your information is secure, and you can unsubscribe anytime. Gain an edge with hand-picked trading opportunities, stay informed with market-moving updates, and learn from expert tips & strategies.

    Recommended

    Quantum Computing Investments: Opportunities & Risks

    Quantum Computing Investments: Opportunities & Risks

    January 31, 2025
    S&P 500 climbed 0.3%, and Nasdaq-100 futures  jumped 0.7%

    S&P 500 climbed 0.3%, and Nasdaq-100 futures jumped 0.7%

    December 26, 2024

    Recent News

    Breakouts, Momentum & Moving Averages: 10 Must-See Stock Charts Right Now

    Breakouts, Momentum & Moving Averages: 10 Must-See Stock Charts Right Now

    June 3, 2025
    The Best Five Sectors, #21

    The Best Five Sectors, #21

    June 3, 2025
    What’s Next for Dollar Tree, CrowdStrike, and Broadcom? Watch These Setups

    What’s Next for Dollar Tree, CrowdStrike, and Broadcom? Watch These Setups

    June 3, 2025
    Hedge Market Volatility with These Dividend Aristocrats & Sector Leaders

    Hedge Market Volatility with These Dividend Aristocrats & Sector Leaders

    June 3, 2025
    Invest Strategies Group

    Browse by Category

    • Business
    • Economy
    • Investing
    • Stock

    Recent News

    Breakouts, Momentum & Moving Averages: 10 Must-See Stock Charts Right Now

    Breakouts, Momentum & Moving Averages: 10 Must-See Stock Charts Right Now

    June 3, 2025
    The Best Five Sectors, #21

    The Best Five Sectors, #21

    June 3, 2025
    • Privacy Policy
    • Terms & Conditions

    Copyright © 2025 investstrategiesgroup.com | All Rights Reserved

    No Result
    View All Result
    • Home 1
    • Home 2
    • Home 3
    • Home 4
    • Home 5
    • Home 6
    • Privacy Policy
    • Suspicious Page
    • Terms & Conditions
    • Thank you

    Copyright © 2025 investstrategiesgroup.com | All Rights Reserved