Friday, June 6, 2025
Invest Strategies Group
  • Investing
  • Economy
  • Business
  • Stock
No Result
View All Result
Invest Strategies Group
  • Investing
  • Economy
  • Business
  • Stock
No Result
View All Result
Invest Strategies Group
No Result
View All Result
Home Stock

Fintech is Leading and Providing a Good Hunting Ground for Bullish Stock Setups

admin by admin
December 7, 2024
in Stock
0
Fintech is Leading and Providing a Good Hunting Ground for Bullish Stock Setups
0
SHARES
0
VIEWS
Share on FacebookShare on Twitter

Chartists looking for stock setups can start with strong industry groups. The Fintech (FINX) is in a strong uptrend and leading, but looking extended short-term. While there is no setup currently, we can learn from past setups and apply these lessons to stocks within the group. 

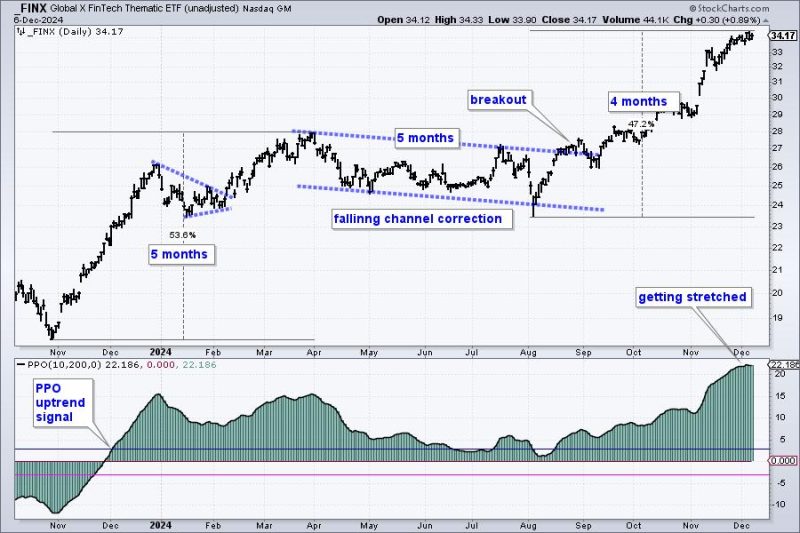
FINX is both strong and extended. The chart shows FINX advancing 53.6% from November to March. It then moved into a long corrective period as the falling channel formed over the next five months. This correction ended with a breakout in late August and the ETF recorded its first new high in mid September. FINX extended further and led the market over the last four months.

Even though FINX shows no signs of weakness on the price chart, it is becoming quite extended because the 10-day EMA is over 20% above the 200-day EMA. The bottom window shows this difference using the PPO(10,200,0). I use this mostly as trend indicator. It turns bullish with a move above +3% and bearish with a move below -3%. These signal buffers reduce whipsaws and catch big trends.

With FINX looking extended, it is time to exercise some patience and wait for the next opportunity. The blue dashed lines show short-term bullish continuation patterns within the strong uptrend. These represent tradable pullbacks. We can use these examples as a guide in the future, and also look for tradable pullbacks individual fintech stocks.  

The indicator window shows %B, which quantifies the relationship between the close and the 20-day SMA. The pullbacks were quite mild as %B dipped below .50 just twice. This means the close was below the 20-day SMA, which is the middle line on the Bollinger Bands. A decline to the 20-day SMA signals a pullback within the uptrend and this is an opportunity, not a threat.

Extended or not, FINX is still a leader and still in a strong uptrend. This means fintech stocks provide a good hunting ground for bullish setups. Pullbacks and oversold conditions provide opportunities. This report continues at TrendInvestorPro where I feature a fintech stock with one such setup. Click here to see the full report and learn more. This week we featured tradable setups in over a dozen ETFs and stocks. 

Click here to take a trial and get two bonus reports!

//////////////////////////////////////////////

Previous Post

NexGen Signs First Uranium Contracts, Will Sell 5 Million Pounds to US Utilities

Next Post

Are ARK’s Innovation ETFs on to Something BIG?

admin

admin

Next Post
Are ARK’s Innovation ETFs on to Something BIG?

Are ARK’s Innovation ETFs on to Something BIG?

    Fill Out & Get More Relevant News


    Stay ahead of the market and unlock exclusive trading insights & timely news. We value your privacy - your information is secure, and you can unsubscribe anytime. Gain an edge with hand-picked trading opportunities, stay informed with market-moving updates, and learn from expert tips & strategies.

    Recommended

    DeepSeek Rattles AI Stocks – Should You Buy The Dip?

    DeepSeek Rattles AI Stocks – Should You Buy The Dip?

    February 1, 2025
    Hedge Market Volatility with These Dividend Aristocrats & Sector Leaders

    Hedge Market Volatility with These Dividend Aristocrats & Sector Leaders

    June 3, 2025

    Recent News

    S&P 500 Bullish Patterns: Are Higher Highs Ahead?

    S&P 500 Bullish Patterns: Are Higher Highs Ahead?

    June 5, 2025
    Strategic Chaos or Tactical Goldmine? What QQQ’s Chart is Whispering Right Now

    Strategic Chaos or Tactical Goldmine? What QQQ’s Chart is Whispering Right Now

    June 5, 2025
    Why ADX Can Mislead You — And How to Avoid It

    Why ADX Can Mislead You — And How to Avoid It

    June 5, 2025
    S&P 500 on the Verge of 6,000: What’s at Stake?

    S&P 500 on the Verge of 6,000: What’s at Stake?

    June 5, 2025
    Invest Strategies Group

    Browse by Category

    • Business
    • Economy
    • Investing
    • Stock

    Recent News

    S&P 500 Bullish Patterns: Are Higher Highs Ahead?

    S&P 500 Bullish Patterns: Are Higher Highs Ahead?

    June 5, 2025
    Strategic Chaos or Tactical Goldmine? What QQQ’s Chart is Whispering Right Now

    Strategic Chaos or Tactical Goldmine? What QQQ’s Chart is Whispering Right Now

    June 5, 2025
    • Privacy Policy
    • Terms & Conditions

    Copyright © 2025 investstrategiesgroup.com | All Rights Reserved

    No Result
    View All Result
    • Home 1
    • Home 2
    • Home 3
    • Home 4
    • Home 5
    • Home 6
    • Privacy Policy
    • Suspicious Page
    • Terms & Conditions
    • Thank you

    Copyright © 2025 investstrategiesgroup.com | All Rights Reserved