Friday, June 6, 2025
Invest Strategies Group
  • Investing
  • Economy
  • Business
  • Stock
No Result
View All Result
Invest Strategies Group
  • Investing
  • Economy
  • Business
  • Stock
No Result
View All Result
Invest Strategies Group
No Result
View All Result
Home Stock

Equities Remain in Strong “Go” Trend as Tech Returns to Leadership

admin by admin
December 10, 2024
in Stock
0
Equities Remain in Strong “Go” Trend as Tech Returns to Leadership
0
SHARES
0
VIEWS
Share on FacebookShare on Twitter

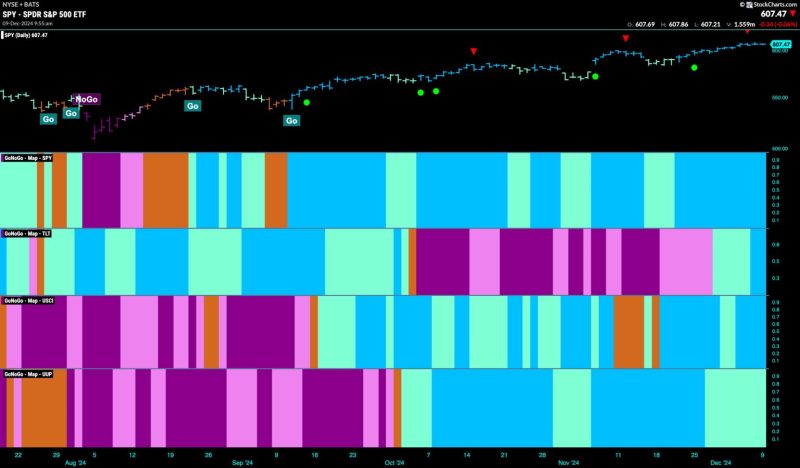
Good morning and welcome to this week’s Flight Path. The “Go” trend in equities continued again this past week and we saw a full week of uninterrupted bright blue bars. Treasury bond prices painted “Go” bars and the week ended with strong blue bars. U.S. commodities also remained in a “Go” trend with the indicator painting strong blue bars. The dollar likewise was able to hold on to its trend but we saw a string of weaker aqua “Go” bars this week.

$SPY Sees Another Strong week of “Go” bars

The GoNoGo chart below shows that price continued to rally this week as the indicator painted nothing but strong blue “Go” bars again. We do see a Go Countertrend Correction Icon (red arrow) at the most recent high which warns us that price may struggle to go higher in the short term. We see that GoNoGo Oscillator has fallen out of overbought territory and is now resting at a value of 4. There is still therefore strong momentum that is confirming the underlying “Go” trend.

On the longer term chart, the trend continues to be strong. Last week saw another higher weekly close albeit on a smaller bar. We will watch to see if price can edge higher again this week. The oscillator panel shows that momentum has been able to remain positive for several months now. It is currently at a value of 5. If momentum wanes, we will look to see if it finds support at the zero level again.

Treasury Rates Fall out of the “Go” Trend

Treasury bond yields completed the transition from a weaker “Go” to strong “NoGo” bars this week. With a couple of amber “Go Fish” bars that expressed uncertainty we can see that the “NoGo” took hold first with a pink bar. This came after GoNoGo Oscillator suggested as much when it failed to find support at the zero line just over a week ago. Now we see that momentum is negative at a value of -3 and confirms the new “NoGo” trend in price.

The Dollar Still Rests in “Go” Trend

We saw the dollar spend another week moving sideways this week and GoNoGo Trend painted a string of weaker aqua “Go” bars.  We turn our eye to the lower panel and we can see that GoNoGo Oscillator has failed to find support at zero after having been stuck there for several bars. The Oscillator has now broken out of a GoNoGo Squeeze into negative territory which tells us that momentum is out of line with the “Go” trend. We will watch to see if this leads to further price deterioration.

Previous Post

Market As Good As It Gets

Next Post

How the Olympics helped transform Salt Lake City into a tech hub

admin

admin

Next Post
How the Olympics helped transform Salt Lake City into a tech hub

How the Olympics helped transform Salt Lake City into a tech hub

    Fill Out & Get More Relevant News


    Stay ahead of the market and unlock exclusive trading insights & timely news. We value your privacy - your information is secure, and you can unsubscribe anytime. Gain an edge with hand-picked trading opportunities, stay informed with market-moving updates, and learn from expert tips & strategies.

    Recommended

    Top Sectors to Watch + The 18 SMA Setup Every Trader Should Know

    Top Sectors to Watch + The 18 SMA Setup Every Trader Should Know

    May 29, 2025
    DP Trading Room: Bitcoin Surges!

    DP Trading Room: Bitcoin Surges!

    March 4, 2025

    Recent News

    S&P 500 on the Verge of 6,000: What’s at Stake?

    S&P 500 on the Verge of 6,000: What’s at Stake?

    June 6, 2025
    Clusters of Long Winning Streaks: What They’re Telling Us

    Clusters of Long Winning Streaks: What They’re Telling Us

    June 6, 2025
    Three Charts Showing Proper Moving Average Alignment

    Three Charts Showing Proper Moving Average Alignment

    June 6, 2025
    In-fill RC Drilling at Kamperman Confirms High-Grade Gold

    In-fill RC Drilling at Kamperman Confirms High-Grade Gold

    June 6, 2025
    Invest Strategies Group

    Browse by Category

    • Business
    • Economy
    • Investing
    • Stock

    Recent News

    S&P 500 on the Verge of 6,000: What’s at Stake?

    S&P 500 on the Verge of 6,000: What’s at Stake?

    June 6, 2025
    Clusters of Long Winning Streaks: What They’re Telling Us

    Clusters of Long Winning Streaks: What They’re Telling Us

    June 6, 2025
    • Privacy Policy
    • Terms & Conditions

    Copyright © 2025 investstrategiesgroup.com | All Rights Reserved

    No Result
    View All Result
    • Home 1
    • Home 2
    • Home 3
    • Home 4
    • Home 5
    • Home 6
    • Privacy Policy
    • Suspicious Page
    • Terms & Conditions
    • Thank you

    Copyright © 2025 investstrategiesgroup.com | All Rights Reserved