
On Tuesday, January 7, 2025, CES (Consumer Electronics Show) 2025 opens its doors in Las Vegas for a four-day event. As the world’s largest technology expo, CES is the hub for global tech innovation, spotlighting the cutting-edge advancements that will define tech trends in the year ahead.
Two key drivers are at the heart of today’s tech focus: semiconductor chips and AI technology. Both present a strong case for investment, and investing in semiconductor companies that enable growth in AI ecosystems is among your strongest bets for profiting from future trends.
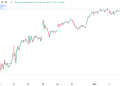
That said, you should look at the semiconductor industry to see which companies offer the strongest opportunities. Let’s begin with VanEck Vectors Semiconductor ETF (SMH) as our industry proxy. Below is a weekly chart.
FIGURE 1. WEEKLY CHART OF SMH. Notice how the Accumulation/Distribution Line (ADL) sits above the current price action. Chart source: StockCharts.com. For educational purposes.

Following a two-year uptrend, SMH appears to be caught within a narrow trading range (see magenta box). The two blue dotted lines mark SMH’s highest high ($281.82) and its corresponding swing low ($199.61). The current price gap indicates a bullish attempt to break out of the current range.
The Accumulation/Distribution Line (ADL), a volume-based indicator that tracks the cumulative flow of money into and out of a security, shows a noticeable rise despite the price remaining stuck in this range. This creates a slight bullish divergence, suggesting that SMH is experiencing capital inflows that could eventually push the ETF above its current trading range.
Now that you have a broader perspective on what semiconductor stocks are doing, let’s zoom in on three that are highly involved in AI tech production:
- NVIDIA Corp. (NVDA): The leader in AI chips.
- Advanced Micro Devices, Inc. (AMD): A secondary competitor in AI-focused GPUs and CPUs.
- Taiwan Semiconductor, Mfg. (TSM): A major foundry for AI semiconductors.
NVDA Testing All-Time Highs
NVDA’s daily chart shows that the stock is experiencing a volatile uptrend and is now experiencing a strong bout of selling after approaching its all-time high of $152.88. The question is whether NVDA is topping out or has enough technical momentum to eventually break through this level and continue setting new record highs.
FIGURE 2. DAILY CHART OF NVDA. Is it toppy or might it have enough momentum to break above its all-time high?Chart source: StockCharts.com. For educational purposes.
NVDA’s StockChartsTechnicalRank (SCTR) score, despite occupying the ultra-bullish 90 range for some time, now stands at around 71. Momentum-wise, the MACD (Moving Average Convergence/Divergence) has begun showing green shoots of bullishness, with the MACD line crossing over the signal line and both appearing to ascend above the center line. This indicates that the stock’s short-term momentum is increasing, which suggests the possibility of continued upward movement.
Add NVDA to your ChartList and look to the trendline as a potential support level should the stock dip. It may present a strong buying opportunity.
AMD: Second Runner Up and Far Behind
Take a look at AMD’s weekly chart.
FIGURE 3. WEEKLY CHART OF AMD. As NVDA’s major competitor, AMD’s performance has been frighteningly poor.Chart source: StockCharts.com. For educational purposes.
AMD is supposed to be NVDA’s most direct competitor in AI chip production. If this is the case, can you expect a dramatic turnaround and substantial growth from where AMD is now?
AMD is far underperforming NVDA, down almost -79%. Watch the most recent bounce (see blue arrow) off the support range marked by the blue rectangle. The chart includes an overlay of a ZigZag line. This outlines the trend movement, showing the critical swing points defining an uptrend and downtrend.
Does the current bounce indicate a refusal to break below the most recent swing low? If so, will AMD have enough momentum to break above the last swing high? This is what’s key to monitor: specifically, whether AMD breaks below the swing low or above the swing high. As for now, the trend is still downward.
Add AMD to your ChartLists and, if you’re bullish, wait for a clear sign of reversal using volume-based and momentum indicators, keeping a tight stop on the most recent swing low. Also, you may want to check the SCTR score to see if it is moving dramatically upward.
TSM: The AI Chip Foundry
Last but not least, there’s TSM, the foundry. Take a look at its weekly chart and compare it to that of AMD.
FIGURE 4. WEEKLY CHART OF TSM. There’s a strong uptrend and the stock has reached a record high.Chart source: StockCharts.com. For educational purposes.
This week, TSM is exhibiting an almost ideal uptrend and gapping upwards to “all-time high” territory. But is it bound for another cyclical pullback or does it have enough momentum to drive higher?
Shift over to a daily chart and you might see something problematic.
FIGURE 5. DAILY CHART OF TSM. There’s a clean uptrend, but money flow is lagging.Chart source: StockCharts.com. For educational purposes.
TSM’s uptrend looks pristine (see blue dotted line). But if you look at the ADL, you’ll notice how the cumulative money flows peaked in early 2024. Now it’s showing a bearish divergence, in which TSM has broken into record highs amid a backdrop of dwindling money inflows.
There’s a strong chance of a pullback, and the current bout of selling may be tipping the market’s hand toward this bias. If TSM finds support at the trendline, look for other signs that momentum may be picking up. If it breaks below the trendline, then look for more downside. Hint: There are rumors that NVDA is evaluating Samsung foundry due to TSM’s high costs and limited production capacity. If that transition goes through, it may impact TSM’s bottom line.
Actions to Take Now
So what can you do from here on?
- Add SMH, NVDA, AMD, and TSM to your ChartLists.
- Watch SMH to see if it successfully challenges resistance at $281.82.
- See if NVDA bounces off the trendline and eventually breaks above $152.88, either of which can serve as a buying opportunity.
- Monitor AMD for signs of a reversal on strong momentum before considering a long position.
- Keep an eye on TSM’s trendline for signs of support or further downside in light of weakening money inflows.
And if you’re interested in all the new tech products, follow CES 2025 reports for insights into new tech trends that could impact the semiconductor sector.
At the Close
Semiconductors and AI remain at the forefront of innovation. CES 2025 is likely to reflect this trend among several of its showcased products. As companies race to meet rising demand in this competitive field, staying alert to rapid developments could offer early insights into future-defining investment opportunities.
Disclaimer: This blog is for educational purposes only and should not be construed as financial advice. The ideas and strategies should never be used without first assessing your own personal and financial situation, or without consulting a financial professional.


