Friday, June 6, 2025
Invest Strategies Group
  • Investing
  • Economy
  • Business
  • Stock
No Result
View All Result
Invest Strategies Group
  • Investing
  • Economy
  • Business
  • Stock
No Result
View All Result
Invest Strategies Group
No Result
View All Result
Home Stock

Mid-Caps Make a Statement with a Breadth Thrust

admin by admin
January 20, 2025
in Stock
0
Mid-Caps Make a Statement with a Breadth Thrust
0
SHARES
0
VIEWS
Share on FacebookShare on Twitter

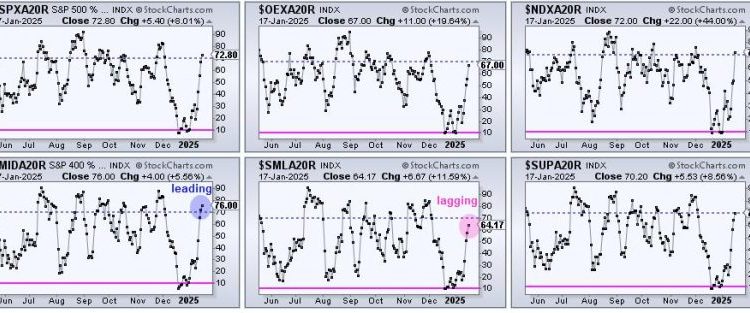
Mid-caps show leadership and were the first to trigger a breadth thrust. Stocks surged this week with mid-caps showing the highest participation rate. Chartists can quantify the participation rate and identify breadth thrusts using the percentage of stocks above their 20-day SMAs. We will analyze these indicators for six broad indexes and show the breadth thrust for the S&P MidCap 400.

Chart Link

The CandleGlance charts above show the percentage of stocks above their 20-day SMAs for the S&P 500, S&P 100, Nasdaq 100, S&P MidCap 400, S&P SmallCap 600 and S&P 1500. We can identify the leaders and the laggards by comparing values. Mid-caps are leading as S&P MidCap 400 Percent Above 20-day SMA ($MIDA20R) surged to 76 percent (blue circle), the highest of the six. This means 76 percent of its component stocks are above their 20-day SMAs. This is a big change because this number was below 10% in mid December. Small-caps are lagging as $SMLA20R finished at 64.17 percent (pink circle). Everything else is in between.

Chart Link

The chart above shows S&P MidCap 400 Percent Above 20-day SMA ($MIDA20R) in the top window with the oversold line at 10 percent (pink) and the thrust line at 70 percent (blue). This indicator formed a bullish divergence and then triggered a breadth thrust on Thursday. A move below 10 percent marks a downside extreme that signals an oversold condition (pink shading). Stocks, however, can become oversold, and remain oversold. Therefore, we need to wait for an upside catalyst. A subsequent move above 70% (blue dashed lines) shows a participation thrust, which means the vast majority of component stocks participated in this advance. Broad participation is bullish. $MIDA20R was the first of the six to cross above 70 percent.

At TrendInvestorPro, we pointed out oversold breadth in December and featured the divergence in Tuesday’s report. A divergence forms when the underlying index ETF (MDY) forges lower lows and the indicator forms higher lows (blue lines). MDY fell from mid December to mid January (lower lows), but fewer stocks within the index moved below their 20-day SMAs during this timeframe. Put another way, more stocks held above their 20-day SMAs. Divergences in March and October 2023 also preceded breadth thrusts.

This week at TrendInvestorPro we covered six Market Regime charts on Wednesday and highlighted seven leading ETFs om Friday’s report/video. Leadership is coming from the middle of the market, and specifically from three sectors. Click here to take a trial and get immediate access.

/////////////////////////////////////////////////

Previous Post

Only One Group Has Shown Consistent Relative Strength For The Past Year

Next Post

JPMorgan Chase CEO Jamie Dimon on Trump tariffs: ‘Get over it’

admin

admin

Next Post
JPMorgan Chase CEO Jamie Dimon on Trump tariffs: ‘Get over it’

JPMorgan Chase CEO Jamie Dimon on Trump tariffs: ‘Get over it’

    Fill Out & Get More Relevant News


    Stay ahead of the market and unlock exclusive trading insights & timely news. We value your privacy - your information is secure, and you can unsubscribe anytime. Gain an edge with hand-picked trading opportunities, stay informed with market-moving updates, and learn from expert tips & strategies.

    Recommended

    Peloton launching resale market for used bikes, treadmills

    Peloton launching resale market for used bikes, treadmills

    June 4, 2025
    With Trump digital coins, billions of dollars — and crypto’s credibility — are at stake

    With Trump digital coins, billions of dollars — and crypto’s credibility — are at stake

    January 23, 2025

    Recent News

    S&P 500 on the Verge of 6,000: What’s at Stake?

    S&P 500 on the Verge of 6,000: What’s at Stake?

    June 6, 2025
    Clusters of Long Winning Streaks: What They’re Telling Us

    Clusters of Long Winning Streaks: What They’re Telling Us

    June 6, 2025
    Three Charts Showing Proper Moving Average Alignment

    Three Charts Showing Proper Moving Average Alignment

    June 6, 2025
    In-fill RC Drilling at Kamperman Confirms High-Grade Gold

    In-fill RC Drilling at Kamperman Confirms High-Grade Gold

    June 6, 2025
    Invest Strategies Group

    Browse by Category

    • Business
    • Economy
    • Investing
    • Stock

    Recent News

    S&P 500 on the Verge of 6,000: What’s at Stake?

    S&P 500 on the Verge of 6,000: What’s at Stake?

    June 6, 2025
    Clusters of Long Winning Streaks: What They’re Telling Us

    Clusters of Long Winning Streaks: What They’re Telling Us

    June 6, 2025
    • Privacy Policy
    • Terms & Conditions

    Copyright © 2025 investstrategiesgroup.com | All Rights Reserved

    No Result
    View All Result
    • Home 1
    • Home 2
    • Home 3
    • Home 4
    • Home 5
    • Home 6
    • Privacy Policy
    • Suspicious Page
    • Terms & Conditions
    • Thank you

    Copyright © 2025 investstrategiesgroup.com | All Rights Reserved