I was taught that the most bullish thing the market can do is go up. And while the major equity averages are yet again at or near all-time highs, there are three macro technical signals that I’ve found to be very common at major market tops.
And while the prevalence of these signals does not guarantee a top will occur in February 2025, it tells me that until these conditions change, further upside could be limited from here.
The Magnificent 7 have transformed into the Meager 7. So which sectors or stocks might take the lead in 2025? Join me in our upcoming FREE webcast on Wednesday 2/26 at 1:00pm ET as we explore sector rotation trends, analyze growth vs. value dynamics, and spotlight stocks gaining momentum in Q1. Can’t make it live? No worries! Just register and I’ll send you the replay as soon as it’s ready. Sign up for Finding Value: The Great Rotation of 2025 today!
Let’s go through these signs of the bear, review recent examples, and discuss what we would need to see to reconfirm a new bull phase for stocks.
Bearish Momentum Divergences Suggest Bull Exhaustion
Our first common feature of bull market tops is a surplus of bearish momentum divergences. When prices move higher on stronger momentum, the uptrend is in good shape. But when prices push higher on weaker momentum readings, that suggests a dangerous situation where selling pressure is not yet being reflected in stock prices.
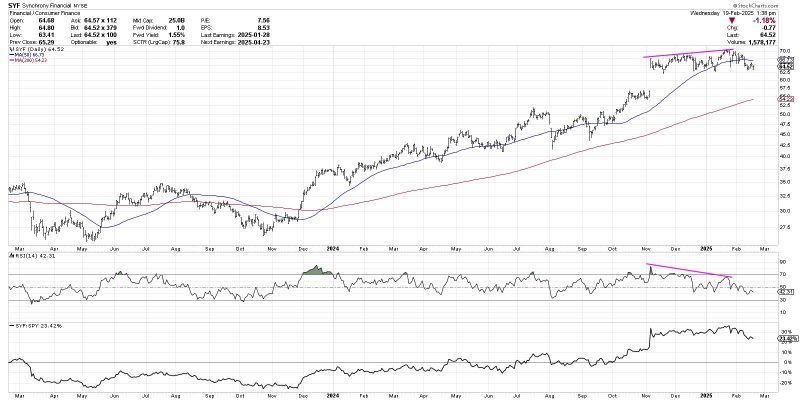
While I could share my chart of the S&P 500, or perhaps Alphabet (GOOGL) which featured a bearish momentum divergence going into its recent high, I’ll go with the daily chart of Synchrony Financial (SYF). Here we can see a clear pattern of higher highs in price from November 2024 through February 2025. But note how the RSI is sloping lower during this period.

When previous leadership names start to flash a pattern of weaker momentum, that illustrates how distribution is occurring which pushes an indicator like RSI lower even though the prices remain in an uptrend. And while this does not necessarily mean a top is in place, it tells me that the current uptrend phase should be brought into question.
Breadth Indicators Have Not Confirmed Recent Highs
Healthy bull markets are marked by improvement in market breadth indicators, as more and more stocks participate in the upside. In recent months, to the contrary, we have seen breadth indicators trending downward while the major averages are making new all-time highs.
Out of the breadth indicators I track on my Market Misbehavior LIVE ChartList, one of my favorites is the simple advance-decline line. And whether we’re looking at the S&P 500 members, the entire New York Stock Exchange, or even mid-caps or small caps, all of these advance-decline lines have been sloping down since November.
To be clear, a breakout in these cumulative advance-decline lines would display a very different picture, representing a broad advance and stronger breadth conditions. But until and unless the A-D lines can propel above their Q4 2024 highs, this remains a market with meager breadth readings.
Dow Theory Non-Confirmation Suggests Limited Upside
Finally, we have an updated version of Charles Dow’s original work comparing different market indexes, a strategy now known as “Dow Theory”. While Dow used the Dow Industrials and Dow Railroads, and though we could use the Dow Industrials and Dow Transports, I prefer to use an equal-weighted S&P 500 versus the equal-weighted Nasdaq 100.
The idea is that if both indexes are making new highs, then the bull market is confirmed. If one is breaking out while the other is now, this represents a “bearish non-confirmation” and suggests limited upside unless that divergence is negated.
The equal-weighted Nasdaq 100 did make a new high in February, pushing above its early December peak. The equal-weighted S&P 500, however, is still well below its own top from late November. Similar to the advance-decline analysis above, if both ETFs finally confirm new highs, then that would suggest further upside for the major equity averages. But for now, this non-confirmation has me questioning the sustainability of the current uptrend phase.
To be clear, my Market Trend Model is still bullish on all time frames, confirming that the primary trend remains positive for the S&P 500. The only way to anticipate a potential top is to look for similar conditions experienced in previous major tops. Based on the charts shared today, we may be nearing the exhaustion point of the current bull market phase.
RR#6,
Dave
PS- Ready to upgrade your investment process? Check out my free behavioral investing course!
David Keller, CMT
President and Chief Strategist
Sierra Alpha Research LLC
Disclaimer: This blog is for educational purposes only and should not be construed as financial advice. The ideas and strategies should never be used without first assessing your own personal and financial situation, or without consulting a financial professional.
The author does not have a position in mentioned securities at the time of publication. Any opinions expressed herein are solely those of the author and do not in any way represent the views or opinions of any other person or entity.


