Saturday, June 21, 2025
Invest Strategies Group
  • Investing
  • Economy
  • Business
  • Stock
No Result
View All Result
Invest Strategies Group
  • Investing
  • Economy
  • Business
  • Stock
No Result
View All Result
Invest Strategies Group
No Result
View All Result
Home Stock

S&P 500 Selloff: Bearish Rotation & Key Downside Targets!

admin by admin
March 6, 2025
in Stock
0
S&P 500 Selloff: Bearish Rotation & Key Downside Targets!
0
SHARES
1
VIEWS
Share on FacebookShare on Twitter

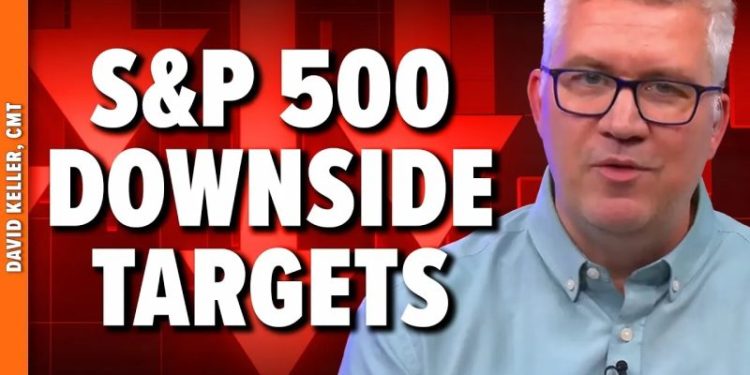
In this video, Dave analyzes market conditions, bearish divergences, and leadership rotation in recent weeks. He examines the S&P 500 daily chart, highlighting how this week’s selloff may confirm a bearish rotation and set downside price targets using moving averages and Fibonacci retracements. To validate a potential end to the bearish phase, he shares a key technical analysis chart. What’s your S&P 500 downside objective?

This video originally premiered on March 4, 2025. Watch on StockCharts’ dedicated David Keller page!

Previously recorded videos from Dave are available at this link.

Previous Post

Navigating Tariffs: Master the Charts to Outsmart Market Volatility

Next Post

Macy’s turnaround hinges on revamping some stores and closing others. It appears to be working.

admin

admin

Next Post
Macy’s turnaround hinges on revamping some stores and closing others. It appears to be working.

Macy’s turnaround hinges on revamping some stores and closing others. It appears to be working.

    Fill Out & Get More Relevant News


    Stay ahead of the market and unlock exclusive trading insights & timely news. We value your privacy - your information is secure, and you can unsubscribe anytime. Gain an edge with hand-picked trading opportunities, stay informed with market-moving updates, and learn from expert tips & strategies.

    Recommended

    Cleantech Market Update: Q3 2024 in Review

    Cleantech Market Update: Q3 2024 in Review

    November 12, 2024
    Oil Breaks Key Pattern: Oil Volatility & Natural Gas Surge

    Oil Breaks Key Pattern: Oil Volatility & Natural Gas Surge

    November 8, 2024

    Recent News

    3 S&P 500 Charts That Point to the Next Big Move

    3 S&P 500 Charts That Point to the Next Big Move

    June 20, 2025
    Joe Rabil’s Undercut & Rally Pattern: From DROP to POP

    Joe Rabil’s Undercut & Rally Pattern: From DROP to POP

    June 20, 2025
    Prospectus

    Prospectus

    June 20, 2025
    Critical Metals Secures US$120 Million Loan LOI for Tanbreez Rare Earths Project

    Critical Metals Secures US$120 Million Loan LOI for Tanbreez Rare Earths Project

    June 20, 2025
    Invest Strategies Group

    Browse by Category

    • Business
    • Economy
    • Investing
    • Stock

    Recent News

    3 S&P 500 Charts That Point to the Next Big Move

    3 S&P 500 Charts That Point to the Next Big Move

    June 20, 2025
    Joe Rabil’s Undercut & Rally Pattern: From DROP to POP

    Joe Rabil’s Undercut & Rally Pattern: From DROP to POP

    June 20, 2025
    • Privacy Policy
    • Terms & Conditions

    Copyright © 2025 investstrategiesgroup.com | All Rights Reserved

    No Result
    View All Result
    • Home 1
    • Home 2
    • Home 3
    • Home 4
    • Home 5
    • Home 6
    • Privacy Policy
    • Suspicious Page
    • Terms & Conditions
    • Thank you

    Copyright © 2025 investstrategiesgroup.com | All Rights Reserved