After a blistering snapback rally over last the week, a number of the Magnificent 7 stocks are actively testing their 200-day moving averages. Let’s look at how three of these leading growth names are setting up from a technical perspective, and see how this week could provide crucial clues to broader market conditions into April.
META Remains Above an Upward-Sloping 200-Day
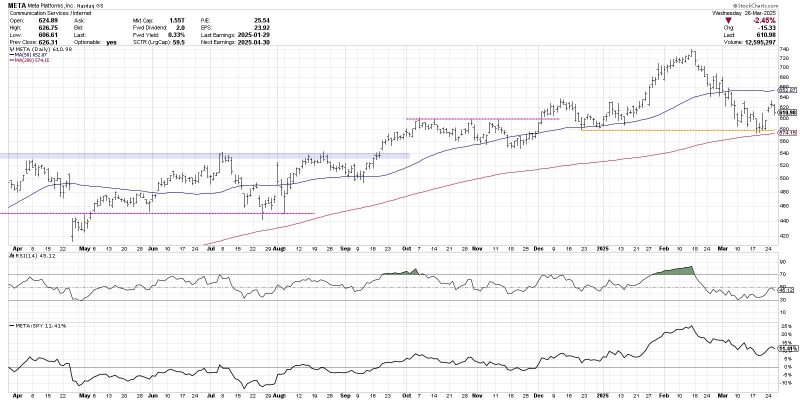
While most of the Mag 7 names already broke below their 200-day moving averages, Meta Platforms (META) is one of the few that have remained above this key trend indicator. We can see a very straightforward downtrend of lower lows and lower highs from the mid-February peak around $740 to last week’s low around $575.
With the recent bounce, META has now established clear support at the 200-day as well as the December 2024 swing low. This “confluence of support” suggests that a break below $575 would confirm a new downtrend phase for this leading internet stock. Only if we saw a break back above the 50-day moving average around $650 would we consider an alternative bullish scenario here.

Will AMZN Hold This Long-Term Trend Barometer?
While META is still holding its 200-day moving average, Amazon.com (AMZN) broke below its 200-day back in early March. The recent bounce off $190 has pushed AMZN back above the 200-day this week, with the Monday and Friday lows sitting almost perfectly on this long-term trend indicator.
The most important question here is whether Amazon will be able to hold above its 200-day, but given the meager momentum readings, a failure here seems more likely. Note how despite the recent uptrend move, the RSI has remained below the 50 level through mid-week. This lack of upside momentum indicates a lack of willing buyers, and suggests a breakout here as an unlikely outcome.
Similar to the chart of META, we’re watching for any move above the 50-day moving average, which would tell us to consider the recent upswing to have further upside potential.
Failure Here Would Signal Renewed Weakness for TSLA
Now we come to one of the weaker charts out of the mega cap growth names, Tesla Inc. (TSLA). Tesla lost over half its value from a peak around $480 in mid-December 2024 to its March 2025 low around $220. This week’s pop higher has pushed TSLA right up to the 200-day moving average, but no further.
Tesla was one of the first Magnificent 7 stocks to set a peak, as many of these growth names continued to make higher highs into early 2025. TSLA finally registered an oversold condition for the RSI in late February, before a bounce in mid-March which pushed the RSI back above the crucial 30 level.
When a stock fails to break above the 200-day moving average, as we see so far this week for Tesla, it means that there just isn’t enough buying power present to reverse the longer-term downtrend phase. Until and unless TSLA can push above the 200-day, we’d much rather look for opportunities elsewhere.
As legendary investor Paul Tudor Jones is quoted, “Nothing good happens below the 200-day moving average.” Given the recent upswings for these key growth stocks, and their current tests of this long-term trend barometer, investors should be prepared for a failure at the 200-day and brace for what could come next for the Magnificent 7.
RR#6,
Dave
PS- Ready to upgrade your investment process? Check out my free behavioral investing course!
David Keller, CMT
President and Chief Strategist
Sierra Alpha Research LLC
Disclaimer: This blog is for educational purposes only and should not be construed as financial advice. The ideas and strategies should never be used without first assessing your own personal and financial situation, or without consulting a financial professional.
The author does not have a position in mentioned securities at the time of publication. Any opinions expressed herein are solely those of the author and do not in any way represent the views or opinions of any other person or entity.


