I feel like the short-term risk is turning once again and I’ll explain why in my analysis below. Please don’t misunderstand. I suggested a bottom was in place a few weeks ago and I LOVE what has been happening in terms of manipulation/accumulation and I LOVE the fact that we were able to quickly regain both the 20-day EMA and 50-day SMA on our major indices.
However, here are the four major indices and where they’re at currently on their respective charts and their next key overhead resistance levels:
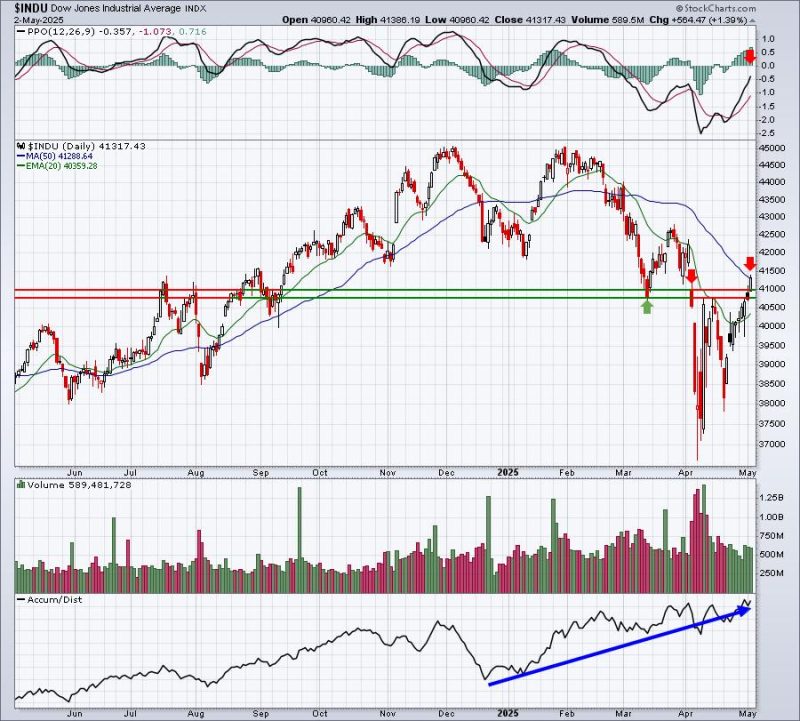
Dow Jones
We did manage to close just above the 50-day SMA here, but the Dow Jones still appears vulnerable to me. Given the fact that the S&P 500 has room to run up to what is now major price resistance at 5782, I could see the Dow Jones moving a bit higher to challenge the late-March high at approximately 42750. That could serve as a neckline.

S&P 500
20-day EMA resistance? No problem, went right through. Gap resistance 5500? Ditto. 50-day SMA resistance. Ditto. This rally has been impressive. Key levels of price resistance have failed and this tells me that we’re not going to violate the low at 4835. It’s set in stone, in my opinion. There are still a couple of key resistance levels on the S&P 500 that we’ll have to deal with next week. The first will be the early-April rebound attempt that failed near 5700. Today’s intraday high was 5700. The next one, however, will be the biggest on the chart and that’s where we last failed in late March – at 5782.
NASDAQ 100:
Looks similar to the S&P 500, but I did add the RSI to this chart. During downtrends, RSI 60 tends to be rather big resistance. We see many rallies fail at or near that level. The NDX just crossed RSI 60….barely. At our Friday intraday high, the NASDAQ 100 pulled within 100 points (less than 0.5%) of the late-March high near 20250. I don’t know if we turn here or not, but I do know the risks are elevated.
Russell 2000:
The 197 level offered great price support on multiple occasions, so when we see a heavy-volume breakdown like we saw in early April, we should recognize how important it is to clear that same price resistance on the way back up. We did so on Friday with gusto. I absolutely LOVE the sudden accumulation that’s taken place in the IWM. I believe that will result in a much larger move at some point later this year. But are we due for another round of selling first, perhaps at upcoming price resistance levels marked above? We’ll soon find out.
Be careful ahead, especially if a rising-volume, reversing candle prints on our major indices sometime next week.
Sentiment
Check out this 5-day SMA of the equity only put call ratio ($CPCE):
We just hit 0.55, showing the most complacency we’ve seen in the past 5 weeks or so. Extreme low readings have previously marked corrections and/or cyclical bear markets and that was one key topping indicator that I discussed back in January/February. Other prior moves down to 0.55 have also resulted in short-term tops. I thought the current .55 reading was worth pointing out for this reason.
Seasonality could also play a role. Early May (through the 5th) tends to provide historical tailwinds, but the middle part of May (6th through 25th) has a history of being rather challenging. The 5th is Monday, so given everything I’ve discussed above and knowing that our bullish seasonal window could soon be closing, watch for a potential reversing candle as a sign to think about reducing risk (covered calls, S&P 500 puts for insurance, moving to cash, etc.).
I’m not ready to definitively call a short-term top here, but I do want to point out that the SHORT-TERM risks of being long right now are growing. Do with that what you may.
If you’d like to follow more articles of mine, please CLICK HERE to join the tens of thousands who’ve already subscribed to our FREE EB Digest newsletter. There is no credit card required and you may unsubscribe at any time.
Happy trading!
Tom


