Breadth became oversold last week and stocks rebounded this week. Is this a robust rebound or a dead cat bounce? Today’s report will show a key short-term breadth indicator hitting its lowest level in 2024 and becoming oversold. A rebound is in place, but it is still too early to call this a robust rebound and we will show the critical level to watch.
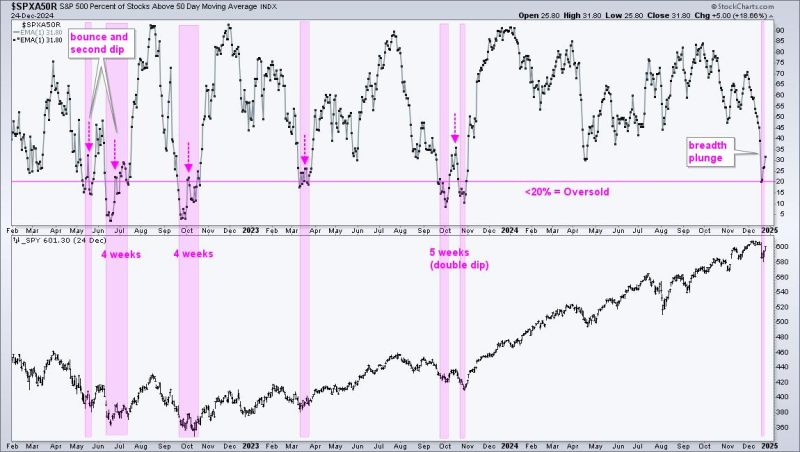
Short-term breadth indicators, such as the percentage of stocks above their 50-day SMAs, are well-suited to identify oversold setups. For example, SPX %Above 50-day SMA fluctuates between 0 and 100%, and becomes oversold with a move below 20%. Such a move signals excessive downside participation that can foreshadow a bounce in SPY. The chart below shows this indicator in the top window and SPY in the lower window. The pink shadings mark oversold periods. There were three in 2022, three in 2023 and just one in 2024, which is a testament to the strong bull market this year.
Oversold is a double-edged sword. While oversold conditions increase the chances for a bounce, an indicator can become oversold and remain oversold. Keep in mind that oversold conditions materialize after strong selling pressure. Stocks were hit hard and often need some time to stabilize before a successful rebound. On the chart above, we can see oversold conditions lasting 4-5 weeks on three occasions. We can also see double dips as the indicator bounced and then dipped back below 20% (pink arrows).

Click here to take a trial and get two bonus reports!
When does an oversold bounce go from a dead cat bounce to a robust rebound? When there is a material increase in upside participation. A move above 50% means the cup is half full for short-term trends. I add a little buffer to this threshold by requiring a move above 60%. This ensures that most stocks are recovering, increasing the chances for a robust rebound. The blue dashed lines on the chart below show these signals.
Signals within bull markets usually work better than signals within bear markets. There were two signals in 2022, which was a bear market period. Price extended higher after these bounces, but the bounces were relatively short-lived as the bear market reasserted control. The bull signal in April 2023 proved timely, as did the bull signal in mid November 2023.
Looking at the current situation, SPX %Above 50-day became oversold with a dip below 20% last week and moved back above 30% this week. Further strength above 60% is needed to show a material increase in upside participation. Given the propensity for double dips, I would also be on guard for another dip below 20%.
We will next look at another short-term breadth indicator for setups and signals. This indicator is more sensitive than SPX %Above 50-day, which can generate timelier signals. This section continues for Chart Trader subscribers.
Click here to take a trial and get two bonus reports!
//////////////////////////////////////////


