The Indian equities continued to trade with a corrective undertone as they ended the week on a mildly negative note. Over the past five sessions, the Nifty continued facing selling pressure at higher levels while staying mainly in a range. The markets remained in a very defined trading range and stayed decisively below key levels. The trading range widened a bit; the Nifty oscillated in 449.45 points before closing towards its lower end of the range. The volatility increased; the India VIX inched higher by 6.33% to 16.75 and stayed at elevated levels. While not showing any major reversal attempts, the benchmark index closed with a net weekly loss of 111 points (-0.48%).
The coming week will be a 6-day trading week. Both NSE and BSE shall conduct a special full-day trading session on Saturday, February 1, 2025, on account of the presentation of the Union Budget.
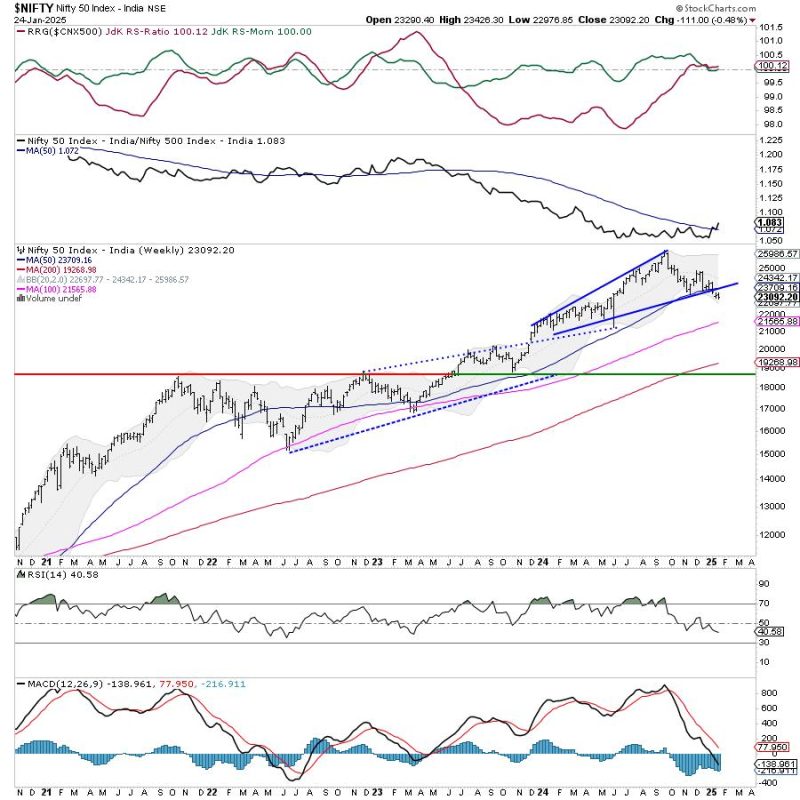
As we commence a new week, it is important to observe that the markets remain decidedly below key levels. The Nifty Index is significantly below its 200-day moving average (200-DMA), which is situated at 23,984. Additionally, a Death Cross pattern has formed on the daily charts as the 50-day moving average (50-DMA) has crossed below the 200-DMA. On the weekly charts, we are also below the 50-week moving average (50-WMA) placed at 23,711. Consequently, even the most robust technical rebounds, should they occur, are likely to encounter resistance around the 23,700 level and higher. In summary, as long as the Nifty remains below the 23,500-23,650 range, it will likely be susceptible to profit-taking at elevated levels.
The levels of 23325 and 23500 are expected to act as potential resistance points in the coming week. The supports are at 22900 and 22650.
The weekly RSI is 40.71. It stays neutral and does not show any divergence against the price. The weekly MACD is bearish and trades below the signal line.

The pattern analysis of the weekly charts shows that the Nifty is now decisively below the 50-week MA at 23711. This means the key resistance level has been dragged lower to this point, even from a medium-term horizon. As evidenced on the chart, while the Nifty breached the 50-week MA, it also slipped below the support of the rising trend line pattern.
Overall, the markets will likely trade with a weak undertone over the immediate short-term. We are likely to see ranged markets with weak undercurrents through the week. However, we will likely see immense volatility on Saturday as we head into the Union Budget on February 1. The markets may see some risk-off sentiment playing out; this is likely to see the traditionally defensive sectors like IT, Pharma, FMCG, etc., doing well. We will also see some Budget-driven movement in a few select pockets. The markets shall fully digest the Budget the week after this one. It is strongly recommended to be very light on positions and keep leveraged exposures at modest levels. A highly cautious view is advised for the coming week.
Sector Analysis for the coming week
In our look at Relative Rotation Graphs®, we compared various sectors against CNX500 (NIFTY 500 Index), which represents over 95% of the free float market cap of all the stocks listed.
Relative Rotation Graphs (RRG) show a lack of leadership in the sectoral setup. The Nifty Realty, Banknifty, Financial Services Index, and the Midcap 100 Index are inside the leading quadrant. Except for the Midcap 100 Index, the rest are showing a decline in their relative momentum. However, these groups are likely to outperform the broader markets relatively.
The Nifty IT index has rolled inside the weakening quadrant. However, stock-specific performance may be seen from this space. The Nifty Pharma and the Services Sector Indices are also inside the weakening quadrant.
The Nifty Metal, Media, PSE, Energy, FMCG, Consumption, and Commodities Indices are inside the lagging quadrant. Most of these sectors are showing sharp improvement in their relative momentum.
The Nifty Auto has rolled inside the improving quadrant, and the Nifty Infrastructure and PSU Bank Indices are also inside the improving quadrant. However, the PSU Bank Index is seen sharply giving up on its relative momentum.
Important Note: RRG charts show the relative strength and momentum of a group of stocks. In the above Chart, they show relative performance against NIFTY500 Index (Broader Markets) and should not be used directly as buy or sell signals.
Milan Vaishnav, CMT, MSTA
Consulting Technical Analyst
www.EquityResearch.asia | www.ChartWizard.ae


