Overall Analysis
- Bitcoin, at a record high of $76,825, continues its rally upwards for a second consecutive day. The price is currently in a strong uptrend.
- Ethereum successfully closed above major resistance, rally seems to continue towards the upside.
Bitcoin Chart Analysis
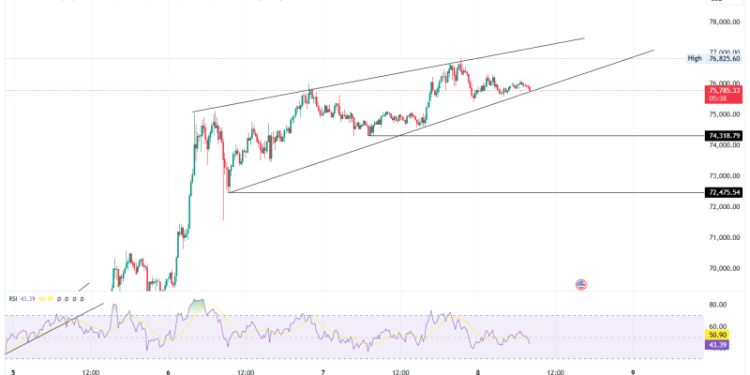
BTC/USD 15-Minute Chart (Source: TradingView)

On the November 7th, 2024 trading session, bitcoin marked a record all-time high of $76,825. Currently, the price is moving in an uptrend, making a higher high higher low pattern with previous swings still intact.
After breaking a strong resistance on October 28th 2024, the price gave a retest and has continued making green candles since the last three trading sessions. RSI has just crossed the 70 mark, indicating an overbought scenario. The price needs to cool off, creating a halt area near an all-time high so as to continue with an upside rally.
Currently, on 15 15-minute time frame price is moving upside down in a higher high and higher low formation. Stong support can be seen taken from the supporting trendline. Such price action makes it easy for traders to plan an entry.
If you are looking for an entry trigger, then there are a few mentioned below.
- If the price bounces back from the supporting trendline with a rejection candle, then buyers may consider entering with the stop loss below the previous swing low and target till $76,800 level.
- If the price closes below the supporting trendline and creates few halt candles, then sellers may consider entering the trade with a stop loss above the previous swing high and target for $74,318 and $72,500 levels.
Ethereum Chart Analysis
ETH/USD 15-Minute Chart (Source: TradingView)
On the November 7th, 2024 trading session, Ethereum successfully closed above the strongest resistance zone and continued moving upwards while taking support on the trendline. If the price successfully sustains above $2,774 for more than 2 to 3 days, then the price can be seen moving up sharply.
Price has successfully closed above the $2,774 level on the daily time frame. Price needs to take a halt at this level so as to further continue the rally. Once the price breaks, the halt area positional trader may consider entry for long-term returns.
Currently, on the 15-minute time frame price can be seen moving upwards while taking support of the trendline, price facing rejection from the $3,924 level.
If you are looking for an entry trigger, there are a few:
- If the price rejects from the supporting trendline, then buyers may consider entering a trade with a stop loss below the previous swing and target till $3,013
- If the price closes below the supporting trendline, then sellers may consider entering the trade with a stop loss above the previous swing high and a target of $2,820
The post Bitcoin Hits $76,825; Ethereum Breaks Key Resistance appeared first on FinanceBrokerage.


