One of my favorite market breadth indicators remained in an extreme bearish reading through the end of last week, standing in stark contrast to growing optimism after last Wednesday’s sudden spike higher. Monday’s session saw the Bullish Percent Indexes cross above the crucial 30% level for both the S&P 500 and Nasdaq 100. While I remain skeptical of meaningful upside without further confirmation, this bullish rotation does seem to confirm a short-term tactical rally for stocks.
Bullish Percent Index Shows Improved Breadth for S&P 500
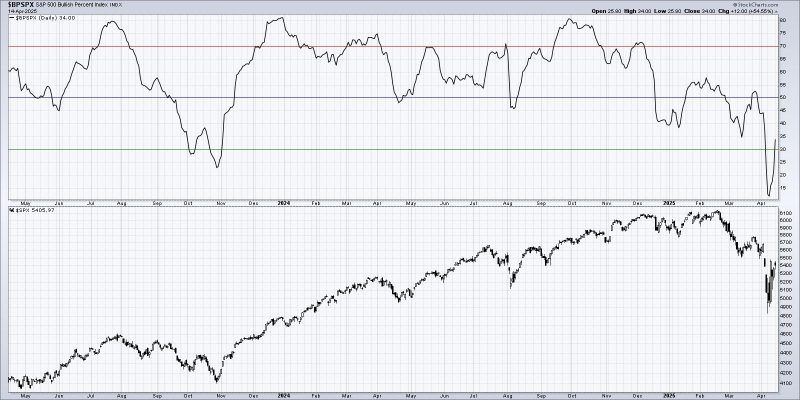
The Bullish Percent Index uses point & figure charts to analyze the percentage of stocks in a universe that are in uptrends. By looking at the most recent buy or sell signal on each individual point & figure chart, the indicator can help validate when a critical mass of stocks have rotated from a bearish phase to a bullish phase.
At the end of September 2024, the S&P 500 Bullish Percent Index showed a reading just above 80%. By early December, the indicator was down to around 70%, and at the February 2025 high had reached 55%. Last week, the S&P 500 Bullish Percent Index was just above 10%. Indeed, almost all of the S&P 500 members were in confirmed point & figure downtrends.

Breadth Surge Similar to Previous Lows
The Bullish Percent Index for the Nasdaq 100 as well as the S&P 500 both spiked higher by the end of last week following the latest changes to US tariff policy. As of Monday’s close the Nasdaq 100 Bullish Percent Index had reached 39%, up from 6% a week earlier.
We can see four other times in the last two years where the Bullish Percent Index has touched the 30% level, and in three of the four times this reversal marked a significant low for the Nasdaq 100. The most recent observation was last month, which saw a brief upswing before the latest downturn for the major equity averages.
So for both the Nasdaq 100 as well as the S&P 500, a move back above the 30% threshold appears to indicate a decent chance at a tradable move higher. But will that upswing necessarily lead to sustainable gains?
Long-Term Review Yields Mixed Results
Let’s take a longer look back to the year 2000 and see what has happened following a move below the 30% level for the S&P 500 Bullish Percent Index. Now we can see that while major lows often coincide with the indicator moving back above 30%, we can also see plenty of times where an initial bounce higher was eventually met with further selling.
Note the extreme low readings in June 2022, August 2015, and January 2009. Even though there was an initial swing higher in all three cases, the market made a new swing low before achieving an eventual bottom for the bear cycle.
With the Bullish Percent Indexes rotating back to a more neutral reading this week, we are seeing plenty of signs of a tactical rally. We may even see our Market Trend Model turn bullish on the short-term time frame as early as this Friday. But with the major averages still making a clear pattern of lower lows and lower highs, we feel further confirmation is necessary before declaring any sort of “all clear” for US stocks.
RR#6,
Dave
PS- Ready to upgrade your investment process? Check out my free behavioral investing course!
David Keller, CMT
President and Chief Strategist
Sierra Alpha Research LLC
Disclaimer: This blog is for educational purposes only and should not be construed as financial advice. The ideas and strategies should never be used without first assessing your own personal and financial situation, or without consulting a financial professional.
The author does not have a position in mentioned securities at the time of publication. Any opinions expressed herein are solely those of the author and do not in any way represent the views or opinions of any other person or entity.


