Saturday, June 7, 2025
Invest Strategies Group
  • Investing
  • Economy
  • Business
  • Stock
No Result
View All Result
Invest Strategies Group
  • Investing
  • Economy
  • Business
  • Stock
No Result
View All Result
Invest Strategies Group
No Result
View All Result
Home Stock

Equities Look for “Energy” in “Go” Trend

admin by admin
November 19, 2024
in Stock
0
Equities Look for “Energy” in “Go” Trend
0
SHARES
0
VIEWS
Share on FacebookShare on Twitter

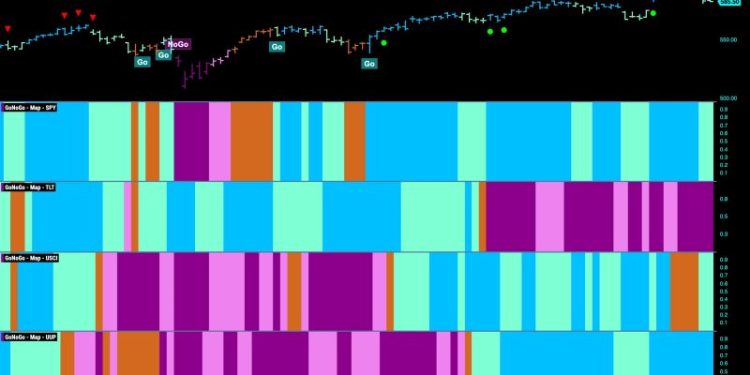
Good morning and welcome to this week’s Flight Path. Equities saw the “Go” trend continue this week but we saw weaker aqua bars at the end of the week. Treasury bond prices painted strong purple “NoGo” bars as the weight of the evidence suggested the “NoGo” will continue. U.S. commodities painted aqua “Go” bars after flirting with amber “Go Fish” bars of uncertainty last week. The dollar showed no weakness this week with an uninterrupted string of bright blue “Go” bars.

$SPY Paints Weaker “Go” Bars after High

The GoNoGo chart below shows that after hitting a new higher high on strong blue “Go” bars we saw a Go Countertrend Correction Icon (red arrow) signaling that price may struggle to go higher in the short term. Indeed, price fell in the following days, and GoNoGo Trend has painted weaker aqua bars. We will watch to see if price finds support at last month’s high. GoNoGo Oscillator also has fallen to test the zero line from above and we will watch to see if it finds support here as well. If the oscillator rallies back into positive territory we will look for price to make an attempt at another higher high.

A Go Countertrend Correction Icon (red arrow) has showed itself on the weekly chart after last week saw price fall into the end of the week. GoNoGo oscillator is in positive territory at a value of 3 and so no longer overbought. We will watch to see if it falls toward the zero line from here and if it does we will monitor for signs of support. GoNoGo Trend is painting strong blue “Go” bars as momentum remains positive confirming the direction of the trend.

Treasury Rates See Continued Strength

Treasury bond yields saw the “Go” trend continue this week and after a couple of weaker aqua bars the indicator showed a return to strength with bright blue bars all week as price rallied to challenge for new highs. GoNoGo Oscillator was perhaps responsible for the rally as we saw it bounce of the zero line into positive territory at the beginning of the week. Now, with GoNoGo Trend painting strong blue bars the oscillator is in positive territory at a value of 2.

The Dollar Remains at Elevated Levels

A week of strength propelled price to new highs again this week as GoNoGo Trend painted a string of unbroken bright blue “Go” bars. We are seeing a Go Countertrend Correction icon (red arrow) on the current bar as there is some waning momentum finally.  GoNoGo Oscillator has fallen out of overbought territory and is approaching the zero line. We will watch to see if it finds support as and when it gets there. If it rallies quickly back into positive territory we will see that as a sign of trend continuation for the greenback.

Previous Post

MarketCarpets Secrets: How to Spot Winning Stocks in Minutes!

Next Post

Target stock falls 21% as big discounting effort falls short

admin

admin

Next Post
Target stock falls 21% as big discounting effort falls short

Target stock falls 21% as big discounting effort falls short

    Fill Out & Get More Relevant News


    Stay ahead of the market and unlock exclusive trading insights & timely news. We value your privacy - your information is secure, and you can unsubscribe anytime. Gain an edge with hand-picked trading opportunities, stay informed with market-moving updates, and learn from expert tips & strategies.

    Recommended

    Smarter Options Trading Starts Here! StockCharts + OptionsPlay

    Smarter Options Trading Starts Here! StockCharts + OptionsPlay

    May 28, 2025
    Chen Lin: Gold, Silver, Critical Minerals — Where I’m Investing in 2025

    Chen Lin: Gold, Silver, Critical Minerals — Where I’m Investing in 2025

    March 12, 2025

    Recent News

    S&P 500 on the Verge of 6,000: What’s at Stake?

    S&P 500 on the Verge of 6,000: What’s at Stake?

    June 6, 2025
    Clusters of Long Winning Streaks: What They’re Telling Us

    Clusters of Long Winning Streaks: What They’re Telling Us

    June 6, 2025
    Three Charts Showing Proper Moving Average Alignment

    Three Charts Showing Proper Moving Average Alignment

    June 6, 2025
    In-fill RC Drilling at Kamperman Confirms High-Grade Gold

    In-fill RC Drilling at Kamperman Confirms High-Grade Gold

    June 6, 2025
    Invest Strategies Group

    Browse by Category

    • Business
    • Economy
    • Investing
    • Stock

    Recent News

    S&P 500 on the Verge of 6,000: What’s at Stake?

    S&P 500 on the Verge of 6,000: What’s at Stake?

    June 6, 2025
    Clusters of Long Winning Streaks: What They’re Telling Us

    Clusters of Long Winning Streaks: What They’re Telling Us

    June 6, 2025
    • Privacy Policy
    • Terms & Conditions

    Copyright © 2025 investstrategiesgroup.com | All Rights Reserved

    No Result
    View All Result
    • Home 1
    • Home 2
    • Home 3
    • Home 4
    • Home 5
    • Home 6
    • Privacy Policy
    • Suspicious Page
    • Terms & Conditions
    • Thank you

    Copyright © 2025 investstrategiesgroup.com | All Rights Reserved