

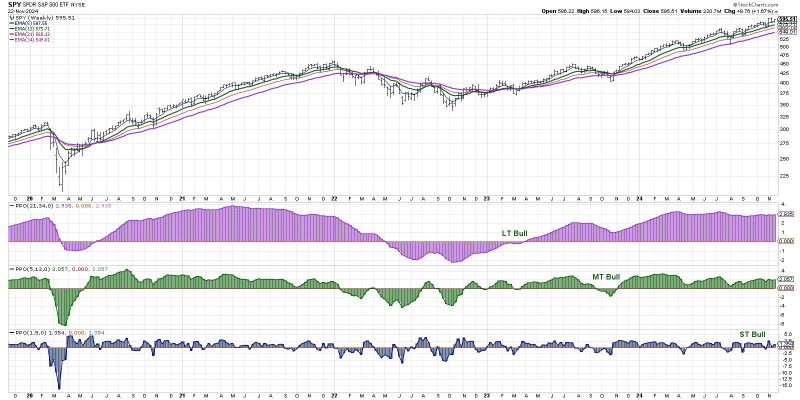
I’ve always found technical analysis to be a fantastic history lesson for the markets. If you want to consider how the current conditions relate to previous market cycles, just compare the charts; you’ll usually have a pretty good starting point for the discussion.
As we near the end of an incredibly bullish year for the S&P 500 and Nasdaq, I’m seeing plenty of signals that suggest the strength of 2024 may lead to a much weaker following year. Today we’ll compare 2024 to 2021, talk about the many conditions which are highly similar, and also review an initial signal from one of the most bearish indicators in our arsenal, the Hindenburg Omen.
Market Trend Model Shows Striking Similarities
2024 has been a strong market year by any standard, from the continuous upward slope of moving averages, to the relatively low volatility compared to previous years, to the minimal drawdowns along the way. My Market Trend Model is what I often use to make an initial comparison between two historical periods, and it certainly backs up this particular conjecture.
Note our long-term model (purple histogram) has been bullish for all of 2024, exactly as we logged in 2021. We can see the same pattern of consistent bullishness from the medium-term mode (green histogram) for both years. Even the short-term model appears to identify pullbacks of a similar timeframe and depth for both years.

2021 Finished Strong, But 2022 Brought a Whole New Trend
2021 ended in a position of strength, with the S&P 500 making a new high going into year-end. However, the moment the calendar was flipped to 2022, everything quickly changed to a bearish phase. The short-term model turned almost immediately, and instead of quickly turning back higher, it remained bearish for weeks at a time.
The medium-term model, which I consider my main risk on/risk off indicator, turned bearish in mid-January and remains so until the end of Q1. So what differentiated early 2022 from the garden variety and very buyable pullbacks of 2021 was that the medium-term model behaved quite differently.
As we head into year-end 2024, this is perhaps the most important chart in my Market Misbehavior LIVE ChartList, as it would help confirm whether an impending selloff is different from the relatively painless and short-lived pullbacks in 2024.
The Hindenburg Omen Suggests a Potential Topping Pattern
Strategist Jim Miekka created the Hindenburg Omen by reviewing a series of previous major market tops and looking for similarities. He honed in on three particular factors:
- The market is in a confirmed uptrend as measured by the 50-day ROC of the NYSE Composite Index ($NYA).
- At least 2.5% of the NYSE stocks make a new 52-week high AND a new 52-week low on the same day.
- The McClellan Oscillator breaks below zero, confirming negative breadth conditions.
One final signal Miekka included was that there should be two independent signals within one month.
In the bottom panel, I’m showing a composite indicator on StockCharts that tracks the three conditions listed above. You may notice that there have been a number of initial signals so far in 2024, but at no time have we received the confirmation signal within one month of the initial signal!
That’s where we’re at as we look forward to year-end 2024 — weakening breadth conditions and investor indecision. Now it’s all about whether we receive that confirmation by mid-December. If so, that would suggest that early 2025 may look painfully similar to a very bearish early 2022!
RR#6,
Dave
P.S. Ready to upgrade your investment process? Check out my free behavioral investing course!
David Keller, CMT
President and Chief Strategist
Sierra Alpha Research LLC
Disclaimer: This blog is for educational purposes only and should not be construed as financial advice. The ideas and strategies should never be used without first assessing your own personal and financial situation, or without consulting a financial professional.
The author does not have a position in mentioned securities at the time of publication. Any opinions expressed herein are solely those of the author and do not in any way represent the views or opinions of any other person or entity.