

In my recent podcast interview with every trading day at 5:00pm ET on our YouTube channel!
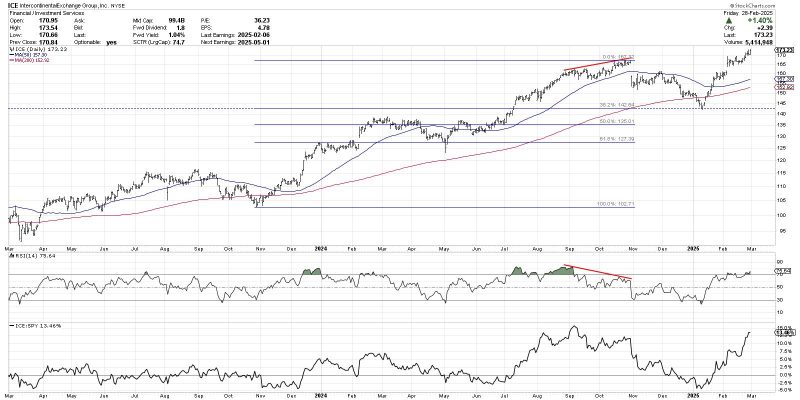
After a major low in October 2023 around $103, ICE spent the next 12 months in a primary uptrend formed by a consistent pattern of higher highs and higher lows. Note the bearish momentum divergence that occurred going into the late October high around $167, and how the subsequent pullback found support right at the 38.2% Fibonacci retracement of the previous uptrend phase.
Over the last six weeks, ICE has reversed course and now sits above two upward-sloping moving averages as it has achieved a new all-time high. The bottom panel provides a fantastic reminder of the value of buying strong charts after they have pulled back to potential support levels, and also shows the impressive outperformance ICE has experienced in 2025.
The daily chart of Visa (V) features a cup-and-handle pattern for much of 2024, with a rounded bottom pattern ending with a brief pullback before a breakout above the “rim” of the cup. From that breakout around $290 in early November 2024, Visa has not looked back. This week, V achieved a new 52-week high, continuing a trend of outperformance that goes back to that November breakout.

Visa is a great example of what comprises a strong technical configuration. Price is making higher highs and higher lows, the two moving averages are both sloping higher, the RSI remains in a bullish range between 40 and 80, and the relative strength has been trending higher. As long as those features remain, the chart suggests further upside potential.
Not all financial names have been breaking out this week, with JPMorgan Chase (JPM) a great example of stocks that have pulled back even though the long-term trend remains strong. This week, JPM dropped to test its 50-day moving average, in a similar fashion to other pullbacks through the last 18 months.
Even with those frequent drawdowns, however, JPMorgan has sustained a bullish momentum configuration, with the RSI usually finding a low around 40 on price pullbacks. The relative strength has improved over the last six months, as JPM has managed to move higher while leading growth names have been struggling to hold key support levels.
One of the most common momentum factors measured by quantitative models is called the “12-1” factor, meaning the 12-month return minus the one-month return. A stock that has experienced a strong 12 months but a weak one-month would score the best. I would guess those momentum models are grading JPM quite well given the recent pullback and long-term bullish phase.
The best way I’ve found to weather periods of market uncertainty is to focus on relative strength, looking for stocks that are able to outperform their struggling benchmarks. These three stocks in the financial sector prove that there are charts out there with decent technical configurations; you just need to know where to look!
RR#6,
Dave
P.S. Ready to upgrade your investment process? Check out my free behavioral investing course!
David Keller, CMT
President and Chief Strategist
Sierra Alpha Research LLC
Disclaimer: This blog is for educational purposes only and should not be construed as financial advice. The ideas and strategies should never be used without first assessing your own personal and financial situation, or without consulting a financial professional.
The author does not have a position in mentioned securities at the time of publication. Any opinions expressed herein are solely those of the author and do not in any way represent the views or opinions of any other person or entity.