
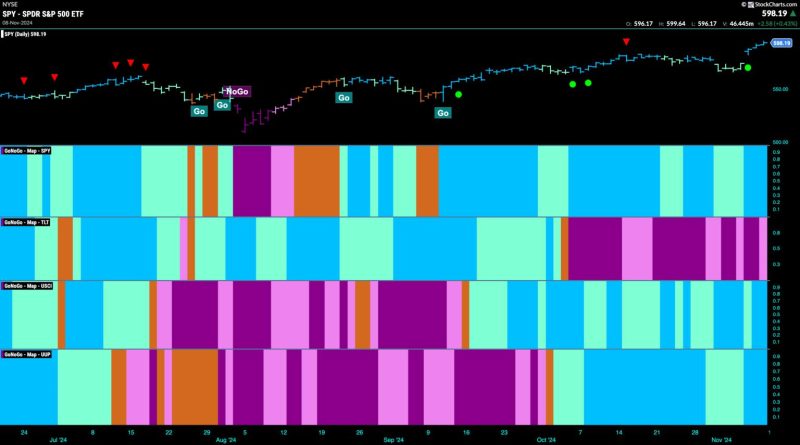
Good morning and welcome to this week’s Flight Path. Equities saw the “Go” trend continued this week and price gapped higher after some weaker aqua bars. We now see GoNoGo Trend painting strong blue bars at new highs. Treasury bond prices remained in a “NoGo” trend but the week ended with a weaker pink bar. The U.S. commodities index saw a strong end to the week as bright blue “Go” bars returned and the dollar likewise saw strength with strong blue “Go” bars the second half of the week.
$SPY Gaps Higher on Strong Blue “Go” Bars
The GoNoGo chart below shows that after some weakness that saw price fall from the last Go Countertrend Correction Icon (red arrow), price gapped higher on Wednesday and prices soared to new highs in the aftermath of the election. GoNoGo Oscillator was able to recover positive territory after having fallen into negative territory the week before. Now, with the oscillator in positive territory at a value 4 on heavy volume, we know that momentum is on the side of the “Go” trend once again.

A new higher weekly close was painted on the chart this past week. After a couple of consecutive lower closes after the recent Go Countertrend Correction Icon (red arrow), we saw price surge to a new higher close. GoNoGo Oscillator had been falling toward the zero level but reversed course sharply this week and is now breaching overbought territory at a value of 5. We will see how much higher price can go from here. We will look for it to at least consolidate at these levels going forward.
Treasury Rates Cool after Higher High
Treasury bond yields saw the “Go” trend continue this week but we saw a little weakness creep in with GoNoGo Trend painting an aqua bar. This comes after we saw a Go Countertrend Correction Icon (red arrow) indicating that price may struggle to go higher in the short term. We will watch to see if price finds support here and sets a new higher low. GoNoGo Oscillator has fallen to test the zero line from above and we know that if the “Go” trend is to remain healthy it should find support at that level. If it can rally back into positive territory then we will know that momentum is resurgent in the direction of the underlying “Go” trend.
The Dollar Jumps Higher
Last week we saw some weakness in the “Go” trend as the indicator painted a string of weaker aqua bars following a Go Countertrend Correction Icon (red arrow). This Icon warned us that price may struggle to go higher in the short term. As price fell from its most recent high, we turned our attention to the oscillator panel. GoNoGo Oscillator fell to test the zero level and quickly found support as volume increased (darker blue of oscillator line). Now, with price making new higher highs and GoNoGo Trend once again painting strong blue bars we know that momentum is resurgent in the direction of the “Go” trend.