Thursday, November 5, 2026
Invest Strategies Group
  • Investing
  • Economy
  • Business
  • Stock
No Result
View All Result
Invest Strategies Group
  • Investing
  • Economy
  • Business
  • Stock
No Result
View All Result
Invest Strategies Group
No Result
View All Result
Home Stock

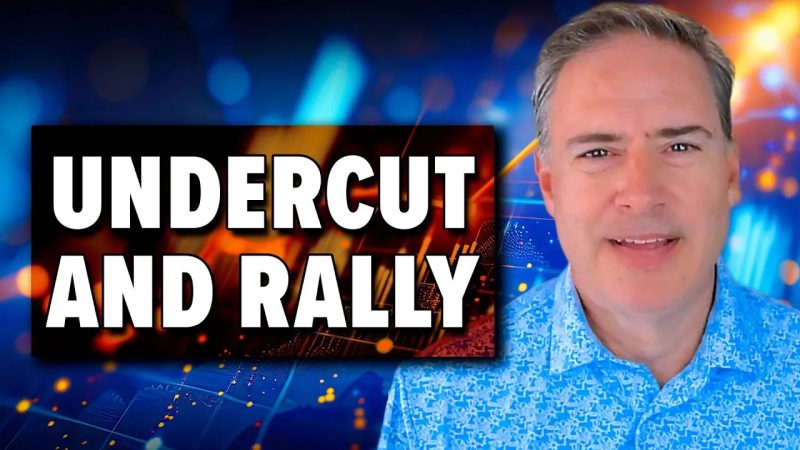
Joe Rabil’s Undercut & Rally Pattern: From DROP to POP

admin by admin
June 19, 2025
in Stock
0
Joe Rabil’s Undercut & Rally Pattern: From DROP to POP
0
SHARES
9
VIEWS
Share on FacebookShare on Twitter

Joe presents his game-changing “undercut and rally” trading pattern, which can be found in high volatility conditions and observed via RSI, MACD and ADX signals. Joe uses the S&P 500 ETF as a live case study, with its fast shake-out below support followed by an equally quick rebound; a good illustration of why lagging indicators can’t be trusted right after a vertical drop.

In addition, Joe maps out three possible scenarios for the S&P: (1) an orderly pullback, (2) a disorderly slide that erases moving-average support, or (3) a breakout. He closes by analyzing viewer requests, spotlighting DOCS and KMI for constructive consolidations, and flagging PGEN as still too weak for a swing entry.

The video premiered on June 18, 2025. Click this link to watch on Joe’s dedicated page.

Archived videos from Joe are available at this link. Send symbol requests to stocktalk@stockcharts.com; you can also submit a request in the comments section below the video on YouTube. Symbol Requests can be sent in throughout the week prior to the next show.


Previous Post

The Secret To Streamlining Your Charting Workflow

Next Post

3 S&P 500 Charts That Point to the Next Big Move

admin

admin

Next Post
Canadian Investment Regulatory Organization Trade Resumption – CYG

Canadian Investment Regulatory Organization Trade Resumption – CYG

    Subscribe to our newsletter for early access to new products, exclusive deals, and exciting updates. Don't miss out! Our subscribers are always the first to hear about limited-time offers and new arrivals. Plus, you'll get sneak peeks and bonus content that adds value to your experience.


    By opting in you agree to receive emails from us and our affiliates. Your information is secure and your privacy is protected.

    Recommended

    Key Levels for AAPL, AMZN, NVDA — Will This Market Rally Hold?

    Key Levels for AAPL, AMZN, NVDA — Will This Market Rally Hold?

    March 25, 2025
    Sunset Oilfield Pumpjacks

    Crude oil price forecast as Brent hits $117 amid US-Iran war fears

    October 25, 2026

    Recent News

    plug power stock

    Plug Power stock is soaring after US midterms: will these gains hold?

    November 4, 2026
    the word REIT is an acronym for real estate investment trust

    Rate Hikes Are Back: What They Mean for REIT Investors

    November 3, 2026
    Here's Why You Shouldn't Use AI to Vote

    Here’s Why You Shouldn’t Use AI to Vote

    November 3, 2026
    holding coins in hand for the future

    2 Dividend Stocks to Hold for the Next 20 Years

    November 3, 2026
    Invest Strategies Group

    Browse by Category

    • Business
    • Economy
    • Investing
    • Stock

    Recent News

    plug power stock

    Plug Power stock is soaring after US midterms: will these gains hold?

    November 4, 2026
    the word REIT is an acronym for real estate investment trust

    Rate Hikes Are Back: What They Mean for REIT Investors

    November 3, 2026
    • Terms & Conditions
    • Privacy Policy

    Copyright © 2026 investstrategiesgroup.com | All Rights Reserved

    No Result
    View All Result
    • Home 1
    • Privacy Policy
    • Terms & Conditions
    • Thank you

    Copyright © 2026 investstrategiesgroup.com | All Rights Reserved