

I was originally taught to use RSI as a swing trading tool, helping me to identify when the price of a particular asset was overextended to the upside and downside. And, on the swing trading time frame, that approach very much works, especially if you employ a shorter time period for the indicator. However, RSI can also be used for longer-term time frames, helping investors to better define trend phases and identify broader shifts in momentum, and today we’ll break down three charts that show how this application of the RSI could help you stay on the right side of strong uptrends!
HubSpot Inc. (HUBS)
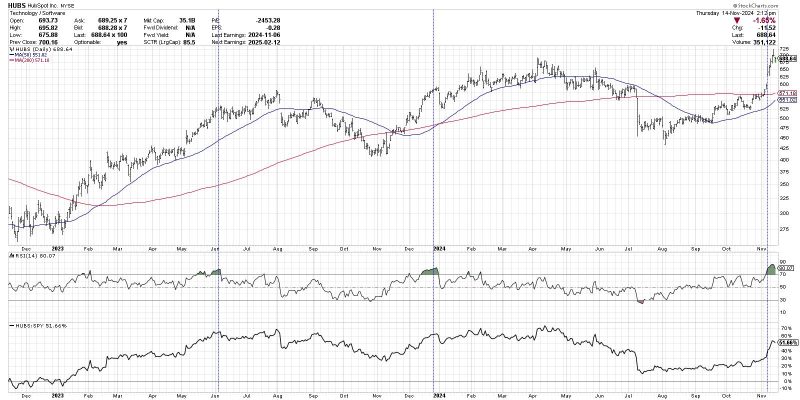
Earlier this week, on my daily market recap show, I was asked about HubSpot, which has recently become overbought. The viewer was concerned about potential downside given the overbought conditions.
What we reviewed was that while an RSI above 70 is considered overbought, an RSI above 80 is considered “extremely overbought”, or what we would often call “the good kind of overbought.” Why consider such a high RSI to be a bullish tell? Just look to the left on the chart of HUBS, at similar readings in June 2023 and December 2023. In both cases, the stock briefly pulled back soon after. And in both cases, the stock went on to make a new 52-week high within a month.

NVIDIA Corp. (NVDA)
Another stock that has shown a similar run of “the good kind of overbought” signals is Nvidia. There have been three such occurrences over the last two years, and, in every instance, these signals have occurred not at the end of the uptrend phase, but in the middle!
It’s worth noting here that Nvidia, along with most other semiconductor stocks, are nowhere near the overbought region given their recent weakness. NVDA is actually featuring the dreaded “bearish momentum divergence” which often serves as a leading indicator of a bearish rotation!
GoDaddy Inc. (GDDY)
GoDaddy is another chart which has recently shown an RSI level above the 80 threshold. And while that could mean a brief countertrend pullback is in store, it also suggests that the long-term uptrend may still be in place.
The last time GDDY saw an RSI above 80 was in November 2023, just before an incredible bullish phase that arguably is still in place in November 2024. So while I could see a short-term pullback as a reasonable expectation between now and year-end, this configuration also serves to reinforce the broader uptrend phase that is still active.
As I was first learning technical analysis back in the day, I thought chart reading was all about finding signals and just blindly following them. Over the years, I’ve come to appreciate that indicators like RSI have layers of value. Mindless investors take indicators at face value. Mindful investors have learned to dig deeper and appreciate the values of learning from previous market cycles!
RR#6,
Dave
P.S. Ready to upgrade your investment process? Check out my free behavioral investing course!
David Keller, CMT
President and Chief Strategist
Sierra Alpha Research LLC
Disclaimer: This blog is for educational purposes only and should not be construed as financial advice. The ideas and strategies should never be used without first assessing your own personal and financial situation, or without consulting a financial professional.
The author does not have a position in mentioned securities at the time of publication. Any opinions expressed herein are solely those of the author and do not in any way represent the views or opinions of any other person or entity.