

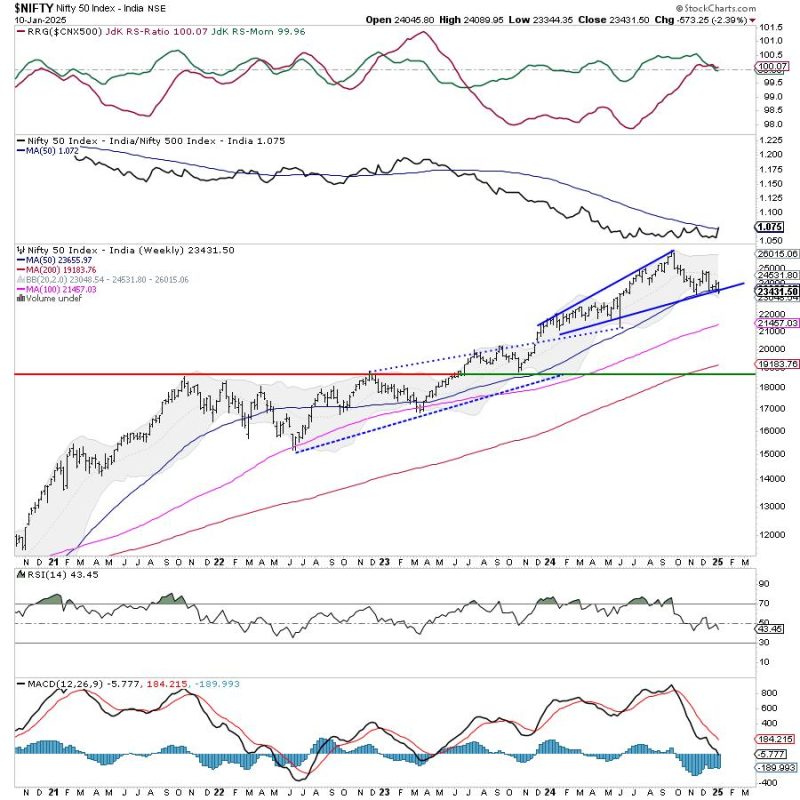
The markets extended their decline over the past five sessions and ended the week on a negative note. While the week started on a bearish note, the Nifty violated a few key levels on higher and lower time frame charts. Along with the weak undercurrent, the trading range widened again as the Nifty moved in a 745-point range. The volatility spiked up, and India Vix surged 10.16% to 14.91 on a weekly basis. Following a thoroughly bearish undertone, the headline index closed with a net weekly loss of 573.25 points (-2.39%).
The week that has gone by has remained important from a technical perspective. The Nifty started the week by violating the 200-DMA placed at 23940 and has closed significantly below this crucial level. On the weekly charts, the Nifty has breached another critical level of 50-week MA, currently at 23659. In the process, the Nifty has dragged its resistance points lower; any technical rebound will find resistance at this point. It is important to note that the 50-week MA has been violated after three retests, and the breach of this level will have bearish considerations for the markets. Unless the Nifty crosses above this level again, it will stay vulnerable to a prolonged phase of weakness.
Monday is likely to see the Nifty beginning on a soft note; the levels of 23650 and 23880 are likely to act as resistance points. The supports come in at 23300 and 23050 levels.
The weekly RSI is 43.53; it has marked a new 14-period low, which is bearish. The RSI also shows a bearish divergence against the price. The weekly MACD is bearish and stays below the signal line. The widening Histogram hints at accelerated momentum on the downside.

The pattern analysis of the weekly chart shows Nifty completing a painful process of mean reversion by finding support at the 50-week MA in November. Since then, it has retested this level three times and has breached it by closing below this crucial level. The 50-week MA is placed at 23659; so long as the Index stays below this point, it remains vulnerable to an extended period of weakness in the near term.
Over the past week, the technical developments have created a strong resistance zone for the Nifty between 23650-24000 level. So long as the Index stays below this zone, it will likely trade with a weak undercurrent. Given the current technical setup, cutting down on leveraged exposures and keeping them at modest levels is extremely important. While initiating fresh exposures, staying in the stocks with strong or improving Relative Strength will be necessary as that would provide resilience to the investments. While staying highly selective, a highly cautious outlook is recommended for the coming week.
Sector Analysis for the coming week
In our look at Relative Rotation Graphs®, we compared various sectors against CNX500 (NIFTY 500 Index), which represents over 95% of the free float market cap of all the stocks listed.
Relative Rotation Graphs (RRG) show that Nifty Bank, Services Sector, Nifty Financial Services, and Nifty IT indices are inside the leading quadrant. Barring the Nifty IT index, all others are seen giving up on their relative momentum. The Nifty Midcap 100 has rolled inside the leading quadrant and may relatively outperform the broader markets.
The Nifty Pharma Index stays inside the weakening quadrant.
The Nifty Metal Index has rolled inside the lagging quadrant. Along with the Media, PSE, Energy, and Commodities, it is likely to underperform the broader markets relatively. The Infrastructure, Auto, FMCG, and Consumption Indices are in the lagging quadrant but are improving their relative momentum against the broader markets.
The Nifty Realty index is well placed inside the improving quadrant. The PSU Bank Index is also inside the improving quadrant, but it is seen paring its relative momentum against the broader markets.
Important Note: RRG charts show the relative strength and momentum of a group of stocks. In the above Chart, they show relative performance against NIFTY500 Index (Broader Markets) and should not be used directly as buy or sell signals.
Milan Vaishnav, CMT, MSTA
Consulting Technical Analyst
www.EquityResearch.asia | www.ChartWizard.ae