

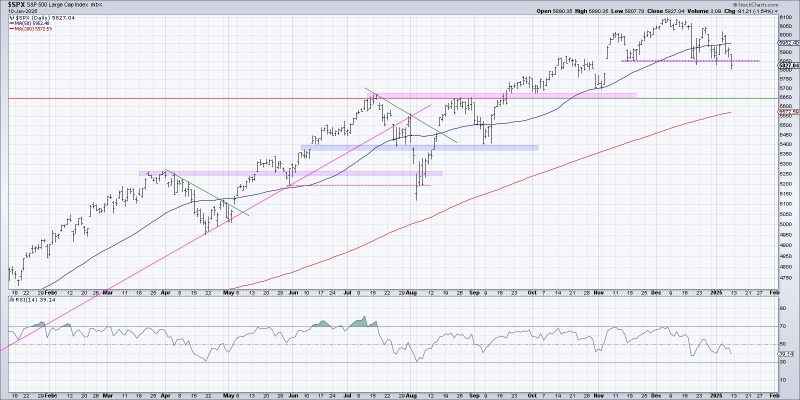
S&P 5850 has been the most important “line in the sand” for stocks since the pullback from the 6000 level in November 2024. With the SPX closing below that 5850 level on Friday, we see further corrective pressures with the 200-day moving average as a reasonable downside target. Today, we’ll break down a series of projection techniques that have helped us hone in on this potential area of support.
The Break of 5850 Completes a Head-and-Shoulders Top
One of the most widely-followed patterns in technical analysis, the fabled head-and-shoulders topping pattern, is formed by a major high surrounded by lower highs on each side. After the S&P 500 established a lower high in December, we immediately started looking for confirmation of this bearish pattern.
To confirm a head-and-shoulders top, and initiate downside targets on a chart, the price needs to break through the “neckline” formed by the swing lows between the head and two shoulders. While price pattern purists may advocate for a downward-sloping trendline to capture the intraday lows of the neckline, I’ve been focused on the price level of SPX 5850. As long as the S&P remained above that level of support, then the market could still be considered in a healthy bullish phase. But a close below the 5850 level on Friday tells me that this corrective move may just be getting started.

Let’s consider some ways to identify a potential downside objective, first using the pattern itself.
Calculating a Minimum Downside Objective
As delineated in Edwards and Magee’s classic book on price patterns, you can use the height of the head-and-shoulders pattern to identify an initial downside objective. Basically, take the distance from the top of the head to the neckline, and then subtract that value from the neckline at the breaking point.
Based on my measurements on the S&P 500 chart, this process yields a downside target of right around 5600. It’s worth noting that Edwards and Magee considered this a “minimum downside objective”, implying that there certainly could be further deterioration after that point has been reached.
Now let’s consider some other technical analysis tools that could help us to validate this potential downside target.
A Confluence of Support Confirms Our Measurement
If we create a Fibonacci framework using the August 2024 low and the December 2024 high, we can see a 38.2% retracement around 5725, which lines up fairly well with the swing low from late October. Perhaps this could serve as a short-term support level during the next downward phase?
As I review the chart, however, I’m struck by the fact that the 50% retracement lines up almost perfectly with our price pattern objective. Many early technical analysts, including the infamous W.D. Gann, favored the 50% retracement level as the most meaningful to watch.
You may also notice that the 200-day moving average is gently sloping higher, rapidly approaching our “confluence of support” around 5600. Given the agreement between multiple technical indicators on this price point, we consider it the most likely downside target given this week’s breakdown.
I would also point that while I feel that identifying price targets can be a helpful exercise, as it gives you a framework with which to evaluate further price action, the most important signals usually come from the price itself. How the S&P 500 would move between current levels and 5600 may tell us a great deal about the likelihood of finding support versus a more bearish scenario in the coming weeks.
RR#6,
Dave
P.S. Ready to upgrade your investment process? Check out my free behavioral investing course!
David Keller, CMT
President and Chief Strategist
Sierra Alpha Research LLC
Disclaimer: This blog is for educational purposes only and should not be construed as financial advice. The ideas and strategies should never be used without first assessing your own personal and financial situation, or without consulting a financial professional.
The author does not have a position in mentioned securities at the time of publication. Any opinions expressed herein are solely those of the author and do not in any way represent the views or opinions of any other person or entity.