

The composition of the top five sectors remains unchanged this week, despite an interrupted trading week. This stability comes against a backdrop of mixed signals and potential defensive rotation in the broader market. Let’s dive into the details and see how these sectors are holding up.
- XLY, Consumer Discretionary
- XLC, Communication Services
- XLF, Financials
- XLK, Information Technology
- XLI, Industrials
Performance-wise, our equal-weight portfolio of these sectors is down 0.66% against SPY, which itself is down 0.44%. (Note: This analysis is based on data about an hour before market close on Friday, January 10th. Any significant shifts after this time will be addressed in a weekend update if necessary.)
Sector-by-Sector Analysis
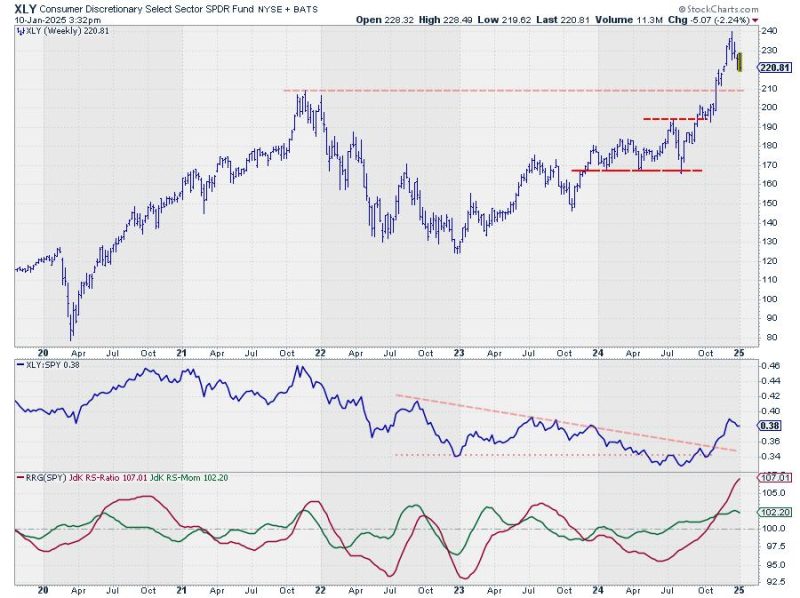
Consumer Discretionary: Strong Despite Decline
Consumer Discretionary remains well above its breakout level, which took out the peak of 2021. As a result, the sector has some room to decline — say, back to the support area around 210 — without harming the uptrend. This resilience keeps Consumer Discretionary in a very strong position despite the current price decline.

Communication Services: Promising but Precarious
The Communication Services sector is holding up from a relative perspective. While the relative strength line and RRG lines are still positive, the RS momentum line is stalling. This is causing the tail on the RRG to roll over, albeit still inside the leading quadrant.
The biggest concern for XLC comes from the price chart. After breaking out in November 2024, the sector is dropping back into the boundaries of its old rising channel. In my experience, when price retreats into a rising channel after an upside breakout, it often tests the lower boundary. For XLC, this could mean a drawback to around 90-92.5 — a support area marked by the rising support line of the old channel.
Financials: Breaking Down
XLF, after a few weeks of consolidation, now seems to be breaking a rising trend line. It’s also close to taking out the previous low around 47.60. If we close below this level on the weekly chart, we’ll have a confirmed lower low and lower high in place for XLF — opening up the downside towards the first support level around 46.
Relative strength for XLF is dropping back below its previous resistance level, which should have acted as support, but isn’t. This is causing the RRG lines to roll over, with XLF’s weekly tail close to crossing from leading into the weakening quadrant.
Technology: Stable but Facing Resistance
The technology sector has remained relatively stable, trading in a condensed area with high volatility over the last 2-3 months.
XLK hasn’t managed to break above the resistance just above 240, which is therefore becoming increasingly heavy. However, it’s still within its rising channel, with potential support of around 222. XLK’s relative strength remains stable, slightly moving higher within its trading range, which is causing both RRG lines to move higher.
With RS ratio below 100 and RS momentum above 100, XLK’s tail is inside the improving quadrant with a positive heading — which continues to make it one of the better sectors.
Industrials: On the Edge
The industrial sector, still number 5 on our list, is testing the lower boundary of its rising channel. So far, it hasn’t broken down.
Relative strength is slowing down, continuing the trend from last week. The tail is still inside the weakening quadrant heading for lagging, but the price decline seems to be stalling at the current level.
Industrials is on the edge — a definitive break out of the rising channel would add to its weakness and lead to even weaker relative strength. For now, though, it’s holding above support despite the loss of relative strength.
RRG Analysis: A Mixed Picture
It’s interesting to note that on the RRG for all sectors, our top five are located either in the leading quadrant (XLY, XLC, XLF), the weakening quadrant (XLI), or the improving quadrant (XLK). All other sectors are inside the lagging quadrant, none with a positive heading.
This RRG isn’t the strongest I’ve ever seen, but it’s all a relative game — and that’s what this experiment is about. We’re trying to beat the S&P 500, so we need to be in the sectors furthest to the right, preferably with a strong heading.
Daily RRG: Signs of Defensive Rotation
When we look at the daily RRG, the picture shifts. While XLC, XLK, and XLY are still furthest to the right (albeit without the strongest headings), XLI and XLF are inside the improving quadrant, rapidly heading towards leading. A quick analysis of other sectors shows Utilities (XLU), Health Care (XLV), and Energy (XLE) rapidly approaching the leading quadrant — indicating a more defensive rotation in the near term.
What’s Next?
The daily RRG’s defensive rotation is translating into a weaker chart for SPY. I’ll be creating a separate article focusing more on the development in the S&P 500 to keep it distinct from this “Best 5 Sectors” series. Be on the lookout for that additional analysis shortly.
#StayAlert and have a great weekend. –Julius